

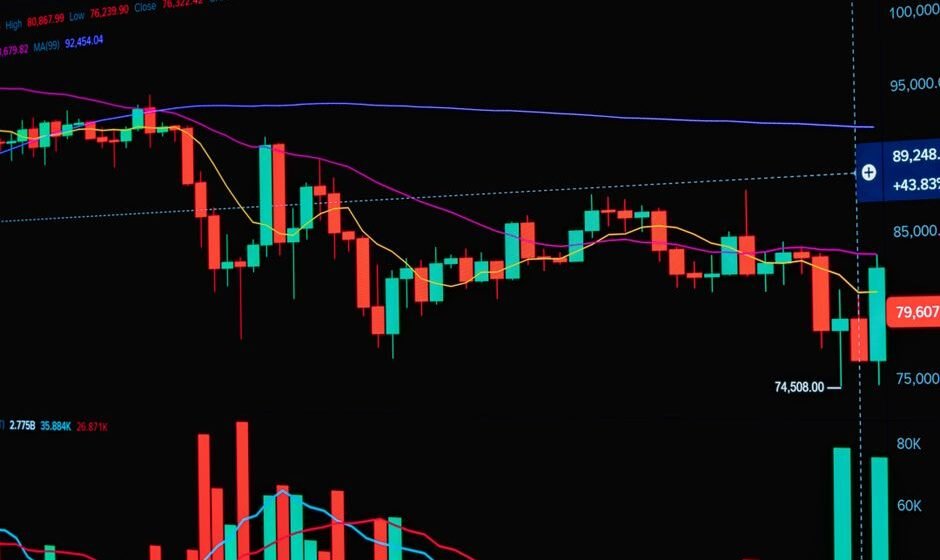

A sideways market is a period where price repeats roughly the same high and the same low without forming a sequence of higher highs and higher lows, or lower highs and lower lows. There is no trend, only a range.
Sideways markets are more common than most traders admit. A large share of trading time on Nifty and Bank Nifty is spent inside ranges, not trends, yet most trading education focuses almost entirely on trend strategies. This post covers how to actually recognise a range, why trend-based tools fail inside one, and what a workable approach looks like when the market is not going anywhere.
Why sideways markets happen
A trend exists when there is a real imbalance between buyers and sellers, one side consistently overpowering the other. A range exists when that imbalance is roughly cancelled out. Buyers step in at a certain level, push price up, sellers step in at another level, push price back down, and neither side can break through the other’s zone.
This often happens around major events. Nifty sitting between 24,300 and 24,700 in the days before a Reserve Bank policy announcement or a large earnings cluster is common, because large participants are unwilling to commit strongly in either direction until the uncertainty clears. It also happens simply as a natural pause after a strong trending move, while the market digests the prior gains or losses before deciding its next direction.
How to actually recognise a range
The clearest sign is structural. If price is not printing a clean sequence of higher highs with higher lows, and also not printing lower highs with lower lows, and instead keeps returning to roughly the same two price zones, that is a range. Draw a horizontal line at the recent swing high and another at the recent swing low. If price has touched each line two or more times without a clean break, you are very likely looking at a range rather than a trend.
ADX is a useful supporting tool here. A reading below 20, or a reading that keeps falling, usually confirms that the market lacks trend strength, which lines up with what the structure is already showing you. Full detail on reading ADX is in ADX Indicator: How to Measure Trend Strength.
Why trend tools fail inside a range
Moving average crossovers, trendline breaks, and breakout strategies are all built on the assumption that price, once it moves in a direction, tends to keep moving in that direction for a while. Inside a range, that assumption is false by definition. Price moves toward one edge of the range, looks like it is breaking out, and then reverses right back toward the other edge.
This produces exactly the pattern traders describe as getting whipsawed. Every apparent breakout triggers an entry, and every entry gets stopped out as price snaps back into the range. This is not bad luck. It is the predictable result of applying a trend tool to a market condition it was never designed for.
A worked example on Nifty
Say Nifty has been trading between 24,300 support and 24,700 resistance for two weeks. A trader using a 9-EMA and 21-EMA crossover system sees the 9-EMA cross above the 21-EMA near 24,550 and buys, expecting a breakout toward new highs. Price rallies to 24,690, just short of resistance, and reverses hard back down through the moving averages, stopping the trade out near 24,500. Three days later the same crossover fires again near 24,400, and the same thing happens in reverse. The tool was not broken. It was applied to a market with no real imbalance to ride.
A trader reading the range structurally, instead, would treat 24,300 as a level to consider buying near, with a tight stop just below it, and 24,700 as a level to consider selling near or booking profit into, rather than expecting either level to break cleanly.
What actually works inside a range
- Fade the edges. Buy near the bottom of the range with a tight stop below it, sell near the top with a tight stop above it. This only works because the range boundaries are the actual source of the setup, not a guess.
- Reduce position size. Ranges tend to have smaller, choppier moves than trends, so risking the same size as you would in a trending market often does not match the smaller reward available.
- Wait for the real breakout. Rather than trading every touch of the range edge as a reversal, some traders wait patiently for a decisive close beyond the range with strong volume, treating that as the start of a new trend rather than another failed poke.
- Reduce trade frequency. Many experienced traders simply trade less inside a confirmed range, since the reward per trade is smaller and the false signal rate is higher.
How ranges usually end
Ranges do not last forever. They resolve when the imbalance between buyers and sellers that had been cancelling out finally tips clearly to one side. This can happen gradually, with price making a slightly higher low inside the range before finally clearing resistance, hinting at the eventual direction in advance. Or it can happen abruptly, triggered by a specific event like a policy announcement or a large earnings surprise that suddenly gives one side a decisive advantage.
Watching how price behaves at the edges of the range in the final days before a breakout often gives useful clues. A range where the lows keep landing slightly higher each time, even while the highs stay capped at the same resistance level, is quietly building pressure toward an eventual upside break, similar to a coiling spring. A range where price starts testing the bottom more often and more aggressively than the top suggests the opposite. Reading this correctly does not guarantee which way the range will resolve, but it does help avoid being caught completely off guard when it finally does.
The hardest part: admitting there is no trend
The technical part of range trading is not especially hard once you know what to look for. The harder part is psychological. Most trading content, and most traders’ own instinct, is built around finding a trend and riding it. Sitting in a range and admitting there is genuinely nothing to chase feels unproductive, even boring, and boredom is a powerful trigger for forcing a trade that is not actually there.
This is where a lot of real damage happens. A trader who can correctly identify a range on the chart still takes a breakout trade at the edge of it, not because the setup justified it, but because two weeks of sideways movement created a restless need to be doing something. The read was accurate. The discipline to sit still inside an accurate read is the part that actually determines the outcome of the week.
Sizing down without losing the habit of trading well
Reducing position size in a range is easy to say and harder to actually do consistently, because a trader’s instinct is often to keep risking the same amount regardless of market condition, treating every session identically. A practical way to handle this is deciding the range-adjusted size in advance, before the session starts, rather than deciding trade by trade while already in the middle of watching price move. Say a trader normally risks a full unit per trade in a trending market. Inside a confirmed range, dropping to half a unit per trade, decided the night before based on the prior day’s range read, removes the in-the-moment temptation to size back up just because one range trade worked well and confidence crept back in too fast.
Frequently asked questions
How do I know if the market is trending or sideways?
Check whether price is forming a clean sequence of higher highs and higher lows, or lower highs and lower lows. If it is instead repeating roughly the same high and low without a clear sequence, it is a range. ADX below 20 supports this read.
Should I stop trading completely in a sideways market?
Not necessarily, but most traders should reduce frequency and position size, and shift from trend-following setups to range-based setups like buying near support and selling near resistance.
Why do my moving average crossovers keep failing?
Crossover strategies are trend tools. If the market is actually ranging, crossovers will fire repeatedly and mostly fail, because there is no sustained imbalance for the trend to follow.
How long do sideways markets usually last?
There is no fixed duration. Ranges can last a few days or several weeks depending on what the market is waiting on, such as a major policy decision or earnings season. Watch the structure rather than assuming a time limit.
What is the safest way to trade a range breakout?
Wait for a decisive close beyond the range boundary, ideally with stronger volume than the earlier failed attempts, rather than reacting to the first touch or wick beyond the level.
The real point
A sideways market is not a broken market. It is a specific, identifiable condition that needs a different toolkit than a trend does.
The chart will tell you honestly which condition you are in. Whether you have the patience to trade what it is actually showing you, instead of what you wish it were showing you, is the real test.
Range mein sabar hi sabse bada trade hai.
Related reading:
- Support and Resistance: How to Actually Draw Them
- Moving Averages: How Traders Actually Use Them
- Volume Analysis: What High and Low Volume Actually Tell You
Spotting a range correctly is easy. Sitting through two boring weeks without forcing a trade you know is not there is the actual test. I run a free live session twice a week for traders with two or more years of experience who know the setups but still cannot execute under pressure. Register for the next free session here.
I am Samir Dash, founder of Mindful Trading Hub. I work with experienced traders on live market decision-making. More about my story here.
