


Open Interest Analysis: Reading What Big Players Are Doing

Open interest tells you how many futures and options positions are still open. What rising and falling OI actually mean, with worked examples.

The Opening Range: Why the First 15 Minutes Matter
The first 15 minutes of Indian market trading set a range that shapes the rest of the day. What the opening range is and how to actually use it.
Gap Up and Gap Down: What Causes Them and How to Trade Them
Why Nifty and stocks gap up or gap down at the open, why gaps often fill, and a simple framework for reacting to a gap without guessing.

ADX Indicator: How to Measure Trend Strength
ADX does not tell you direction, it tells you strength. What ADX actually measures, how to read the levels, and how to combine it with structure.
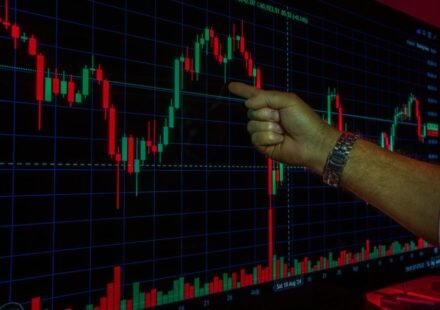
Higher Timeframe Trend vs Lower Timeframe Noise
The 5-minute chart and the daily chart often disagree. Why the higher timeframe usually wins, and how to use both without confusing yourself.
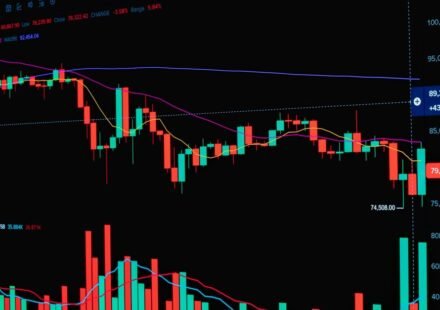
Sideways Market: How to Trade When There Is No Trend
Most tools fail in a sideways market. How to actually recognise a range, why trend tools whipsaw inside it, and what to do instead.

Break of Structure: What It Means and How to Trade It
A break of structure is the moment a trend officially changes. What it actually means, how to confirm one, and how to trade it without jumping the gun.

How to Identify a Trend Change Before Everyone Else
Trend reversals leave clues before they happen. The real early warning signs, why they show up before price confirms, and how to read them.

Market Structure: How to Read Higher Highs and Lower Lows
Market structure is the skeleton under every chart. What higher highs, higher lows, and structure breaks actually mean, and how to read them correctly.
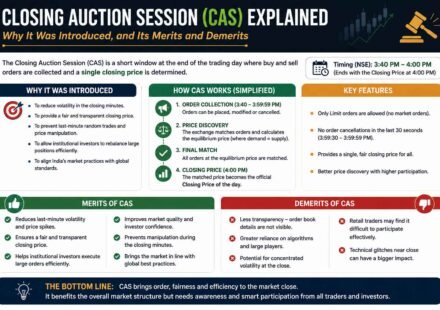
Closing Auction Session (CAS) Explained: Why It Was Introduced, and Its Merits and Demerits
A plain-English guide to India's new Closing Auction Session for Nifty and other F&O stocks: how it works, why SEBI introduced it, and its real merits and demerits.