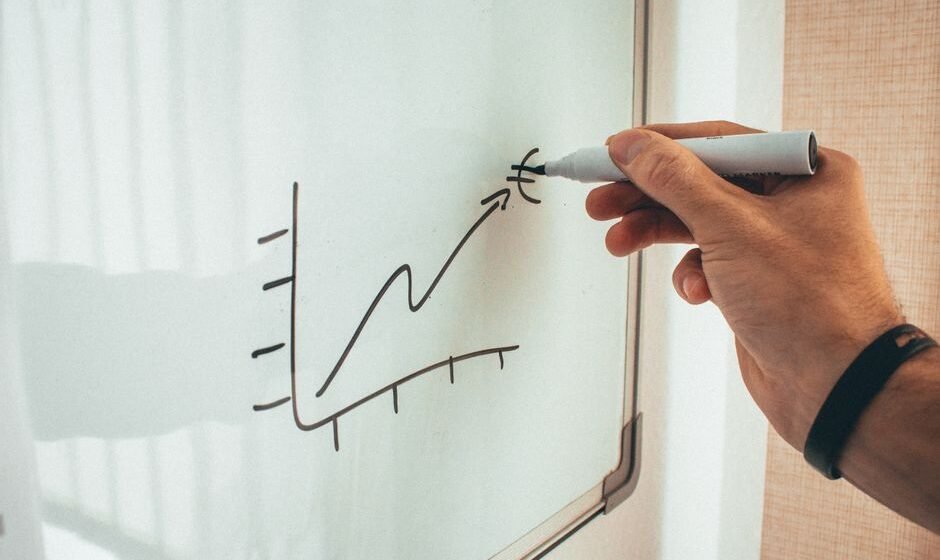

Support is a price level where buying has shown up before, strong enough to stop a fall and turn it around. Resistance is a price level where selling has shown up before, strong enough to stop a rise and turn it around.
That is the whole idea. Everything else in this post is about how to find these levels correctly, because most traders mark them badly and then wonder why price “breaks” their line every time.
This is the pillar post for this topic. It covers how to draw levels the right way, why they work, and how to actually use them in a live trade.
Why these levels exist at all
A support or resistance level is not a magic line. It is a record of past decisions by real traders.
Say Nifty fell to 24,750 three times in the last two months and bounced each time. That means a group of buyers stepped in at 24,750 three separate times. Some of them are still holding those positions. If price comes back to 24,750 a fourth time, a few things happen at once:
- The traders who bought at 24,750 before and made money may buy again, because the level worked for them.
- Traders who missed the earlier bounces may jump in this time, because they have now “seen” the level work three times.
- Traders who are short from higher up may book profit near 24,750, since that is where the fall has stopped before, adding more buying pressure.
All three groups buying near the same price is what makes the level real. It is not the line that causes the bounce. It is the coordinated behaviour of traders who are all watching the same price.
Resistance works the same way in reverse. A level where sellers have shown up repeatedly, because people bought there earlier and are relieved to get out even, or because new sellers see a level that has capped price before and short it again.
How to actually draw the levels
Most bad support and resistance comes from one mistake: drawing a line through a single candle wick and calling it a level.
Do this instead.
Step 1: Use the higher timeframe first
Start on the daily chart, not the 5-minute chart. A level on the daily chart has more traders watching it and more capital behind it. If you only look at 5-minute charts, you will mark ten levels a day and most of them will mean nothing.
Step 2: Look for price reacting, not just touching
A real level is where price stalled, reversed, or moved sharply away, more than once. One touch is not a level yet, it is just a point on the chart. Two or more clear reactions at roughly the same price is what you are looking for.
Step 3: Mark a zone, not a single line
Price rarely reverses at the exact same number every time. If Nifty bounced at 24,742, then 24,758, then 24,750, do not draw a line at exactly 24,750. Mark a zone from about 24,740 to 24,760. Think of it as a band where reactions have happened, not a laser line.
Step 4: Prefer levels where candle bodies cluster, not just wicks
A level with several candle closes near it is stronger than a level made only of long wicks. Closes show where traders were willing to hold overnight. Wicks show a brief poke that got rejected fast. Both matter, but a level built on closes is usually more reliable.
Step 5: Note round numbers separately
If your zone lines up with a round number like 24,750 or 25,000, treat that as extra confirmation, not a separate reason on its own. We cover why round numbers matter in a separate post on round number psychology.
Support becomes resistance, and back again
One of the most useful ideas in this topic is role reversal. Once a support level breaks and price falls through it, that same level often becomes resistance later.
Here is why. Traders who bought at that support and got trapped when it broke are now sitting on a loss. Many of them are waiting for price to come back near their entry so they can exit at breakeven. That creates a wave of selling exactly at the old support level, which is now acting as resistance.
This works in both directions. Broken resistance often becomes support later, for the same reason in reverse: short sellers who got trapped want to cover near their entry, and that covering shows up as buying.
How strong is a level, really
Not every level deserves the same respect. A few things make a level stronger:
- More reactions, up to a point. A level tested twice with strong reactions is usually more reliable than one tested only once. But a level tested many times can also weaken, more on that in the next post on why levels fail.
- Higher timeframe. A weekly support level generally matters more than an intraday one, because more capital and more traders are watching it.
- Volume at the level. If big up-moves or down-moves happened around that price with heavy volume, more traders have a stake in that price.
- Confluence. If a support level lines up with a trendline, a round number, and a prior swing low, that is three independent reasons pointing to the same price. Confluence like this is worth more than any single reason alone.
Using the level in a real trade
Marking a level correctly is only half the job. The other half is deciding what to do when price actually gets there.
A common plan looks like this:
- Mark the zone in advance, before price gets close to it. Do this the night before or in the morning, not while price is already there.
- Wait for price to enter the zone and show a reaction. This could be a rejection candle, a slowdown in the fall, or a clear bounce on lower timeframe.
- Enter with a stop just beyond the far edge of the zone, not right at the level itself. Give the trade room, since price often pokes through a level before reversing.
- Have a target in mind before entry, usually the next visible level above (for a long trade) or below (for a short trade).
Here is the part most technical analysis content skips. You can mark the zone at 24,740 to 24,760 perfectly, and still freeze when price actually gets there. The chart work was correct. The problem was not the level, it was you, in the moment, watching your capital sit two points from your stop and deciding not to pull the trigger, or pulling it too early out of impatience. Knowing where the level is and being able to act on it calmly under pressure are two completely different skills, and most traders only train the first one.
Common mistakes to avoid
- Drawing too many levels. If your chart has fifteen lines on it, none of them mean anything. Keep only the ones with clear, multiple reactions.
- Redrawing lines after the fact. If you keep moving your line to match wherever price stopped, you are not using support and resistance, you are just describing what already happened.
- Treating every touch as a signal. A level is a place to pay attention, not an automatic buy or sell button. Wait for confirmation.
- Ignoring the trend. A support level in a strong downtrend is far less reliable than one in a sideways market. Context matters more than the line itself.
Frequently asked questions
What is the difference between support and resistance?
Support is a price level where buying has stopped a fall in the past. Resistance is a price level where selling has stopped a rise in the past. Both are zones of past reaction, not exact prices.
How many times should a level be tested before I trust it?
Two clear reactions is usually enough to call it a level worth watching. There is no fixed number, since context, timeframe, and volume all matter. A level tested many times can also start to weaken, which we cover in the next post.
Should I use closing prices or wicks to draw support and resistance?
Both, but weigh them differently. A cluster of candle closes near a price shows real conviction. Long wicks alone show a brief rejection but less commitment. A zone built from both closes and wicks, with closes given more weight, tends to work best.
Why does price break my support level and then come right back?
This often happens when a level gets broken briefly to trigger stop losses sitting just below it, and there is not enough follow-through selling to keep price down. This is sometimes called a stop hunt or a fakeout. Waiting for a candle to close beyond the level, not just touch it, filters out a lot of these false breaks.
Is support and resistance more reliable on higher timeframes?
Generally yes. A weekly or daily level has more traders and more capital behind it than a 5-minute level. That does not make lower timeframe levels useless, but they should be treated as less significant on their own.
The real point
Support and resistance is not about finding the perfect line. It is about understanding why traders act the way they do at certain prices, and building a plan for what you will do when price gets there.
The market does not reward better predictions. It rewards better decisions.
Level sahi mark karna aadha kaam hai, baaki aadha waha pe sahi decision lena hai.
Related reading:
- Price Action Trading: A Practical Guide
- Market Structure: How to Read Higher Highs and Lower Lows
- Chart Patterns Every Trader Should Know
- Gap Up and Gap Down: What Causes Them and How to Trade Them
Want the complete course? This fits into Samir Dash’s free Price Action Trading course on this site, a full step by step guide from the basics onward.
Marking the level correctly is not the hard part. Acting on it calmly, when your capital is actually on the line, is. I run a free live session twice a week for traders with two or more years of experience who know the setups but still cannot execute under pressure. Register for the next free session here.
I am Samir Dash, founder of Mindful Trading Hub. I work with experienced traders on live market decision-making. More about my story here.