

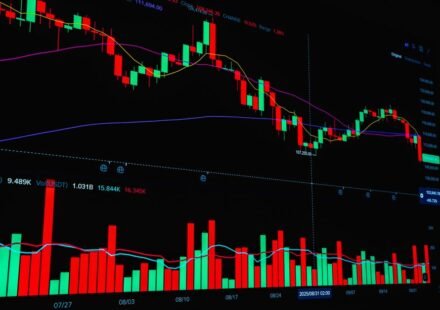
Engulfing Candlestick Pattern: Bullish and Bearish

The engulfing pattern shows a full change of control in one session. How bullish and bearish engulfing candles form, and how to trade them.
Hammer and Hanging Man Candlestick Patterns Explained
The hammer and hanging man look identical but mean different things depending on the trend. How to tell them apart and trade them correctly.
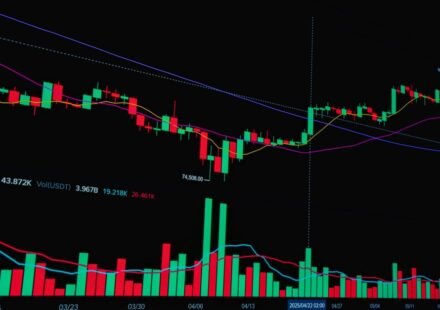
Doji Candlestick Pattern: What It Really Means
The doji candle looks like nothing happened, but it shows a real fight between buyers and sellers. What it means, its types, and how to trade it.
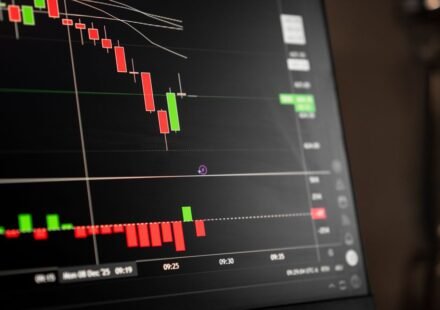
Candlestick Patterns: The Complete Guide for F&O Traders
A clear, practical guide to candlestick patterns. What each candle tells you about buyers and sellers, and how to actually use it while trading.

How to Build a Pre-Market Chart Checklist
A step-by-step pre-market chart checklist you can actually use every day. What to check, in what order, and why each step earns its place.
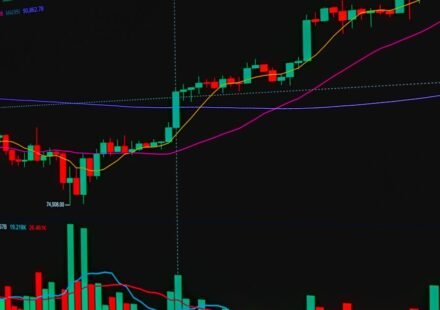
Why Your Technical Analysis Is Correct But You Still Lose Money
Your chart reading is not the problem. Here is the real mechanism behind why correct technical analysis still leads to losses, and what actually fixes it.
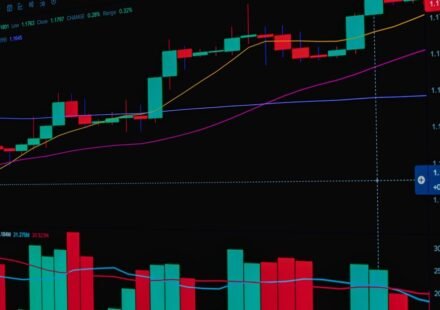
Technical Analysis for Bank Nifty: What Is Different
Bank Nifty behaves differently from Nifty on the chart. Here is what actually changes in your technical analysis and why it matters for your trades.
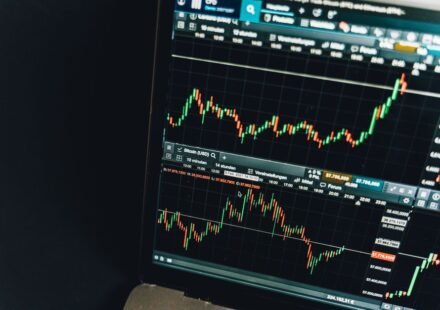
Option Chain Basics: What the Data Is Actually Telling You
Open interest, PCR and max pain explained simply. What the option chain actually measures and how to read it without overinterpreting it.

How to Read a Nifty Chart Before the Market Opens
A practical routine for reading the Nifty chart before 9:15 AM. Levels, gaps, structure and what actually matters in your pre-market prep.
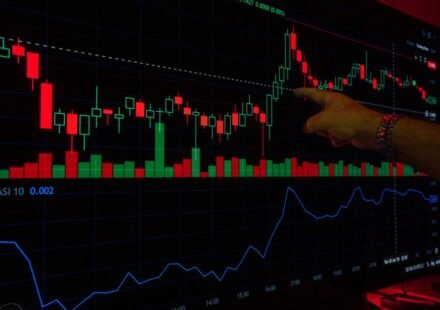
Why Adding More Indicators Makes Your Trading Worse
More indicators feel like more confidence but often mean more confusion. Why stacking indicators hurts your trading and what to do instead.