
Price action trading means making trading decisions based on the movement of price itself, the candles, the highs and lows, the speed of moves, rather than relying mainly on indicators like RSI, MACD, or moving averages.
That does not mean indicators are useless. It means price itself, read carefully, already contains most of the information a trader needs. This is the pillar post for this topic. It covers the core building blocks of price action, how they fit together, and how to build a simple, practical plan around them without turning your chart into a mess of lines and indicators.
Why price action works as an approach
Every indicator on your chart is calculated from price. RSI is a formula applied to closing prices. Moving averages are an average of past closing prices. Volume-based indicators combine price and volume. None of them contain information that was not already present in the raw price movement.
Price action trading skips the middle step. Instead of waiting for a formula to process price and generate a signal, you read the raw movement directly, which means you see what is happening sooner, and you avoid the lag that comes with most indicators.
This does not make price action automatically better than indicator-based trading. It makes it a different lens, one that many experienced traders find gives a clearer, faster read on what buyers and sellers are actually doing, without the smoothing and delay indicators add.
The core building blocks
1. Candlesticks
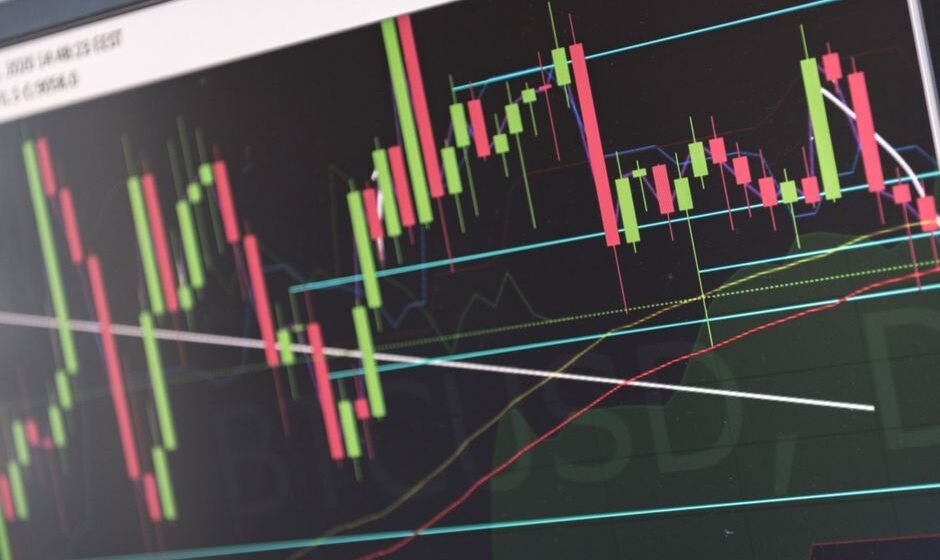
A single candle tells you the open, high, low, and close for that period, along with the fight between buyers and sellers during it. A long green candle with a small wick shows buyers were in control from start to end. A candle with a long lower wick and a small body shows sellers pushed price down, but buyers fought back hard before the close. Reading individual candles is the smallest unit of price action.
2. Support and resistance
Levels where price has reacted before, covered in full in the post on support and resistance. These levels give price action context, telling you where a reaction is more likely to matter.
3. Trendlines and market structure
Whether price is making higher highs and higher lows (an uptrend), lower highs and lower lows (a downtrend), or moving sideways. This structure, covered in the post on trendlines, tells you the broader direction you are trading with or against.
4. Volume
How much trading activity accompanied a price move. A breakout on heavy volume carries more weight than the same breakout on thin volume. This is covered in detail in the post on reading volume alongside price action.
5. Candlestick patterns
Specific arrangements of one or more candles that tend to show up at turning points or continuation points. A few of the most useful ones are covered below.
A few reliable candlestick patterns worth knowing
- Pin bar / rejection candle. A candle with a small body and a long wick on one side, showing price was pushed strongly in one direction and then rejected back. A long lower wick at a support level suggests buyers stepped in hard after sellers tried to push price lower.
- Engulfing candle. A candle whose body completely covers the previous candle’s body, in the opposite direction. A bullish engulfing candle after a downtrend shows buyers overwhelming the previous session’s selling.
- Inside bar. A candle whose entire range sits inside the previous candle’s range, showing a pause or indecision. Often used as a signal that the market is coiling before a bigger move.
- Doji. A candle where the open and close are very close together, showing a genuine standoff between buyers and sellers. More meaningful after a strong trend, where it can signal exhaustion.
None of these patterns work in isolation. A bullish engulfing candle in the middle of a range means far less than the same candle forming exactly at a well-tested support zone.
How the pieces fit together
Price action trading is not about memorising twenty candlestick names. It is about combining a small number of tools into a coherent read of what is happening.
A simple sequence many traders use:
- Identify the broader trend using market structure, higher highs and higher lows, or the reverse.
- Mark the key support and resistance levels on the timeframe you trade.
- Wait for price to reach one of those levels.
- Look for a candlestick signal, a rejection candle, an engulfing pattern, confirming buyers or sellers are stepping in at that level.
- Check volume to see whether the move has real participation behind it.
- Enter with a defined stop and target based on the next visible level.
This sequence is simple on paper. Executing it in real time, with your own money on the line, is a different matter entirely.
Where price action trading goes wrong
- Pattern hunting without context. Seeing a bullish engulfing candle and buying it regardless of where it sits on the chart. The pattern needs a location that makes sense, usually a support level or the base of a demand zone.
- Ignoring the broader trend. A bullish reversal pattern inside a strong downtrend on a higher timeframe is a much lower probability trade than the same pattern inside an uptrend pullback.
- Overloading the chart. Adding ten indicators on top of price action defeats the purpose. Price action works best when the chart is clean enough that you can actually see what price is doing.
- Treating patterns as certainties. A candlestick pattern shifts the odds. It does not guarantee an outcome. Anyone claiming a specific pattern “always” leads to a specific result is overstating what price action can tell you.
The gap between reading price action and trading it
This is the part that separates traders who know price action from traders who profit from it. Reading a chart after the fact is easy. Anyone can look at a completed chart and point out the bullish engulfing candle at support that led to a 200-point rally. Doing that same read in real time, with the candle still forming, your stop loss decided but not yet placed, and the outcome unknown, is a completely different exercise.
Most traders who study price action for a year or two get genuinely good at the reading part. The setups are correctly identified more often than not. What breaks down is the moment between seeing the setup and clicking buy or sell, when doubt creeps in, or the moment right after entry, when a normal pullback feels like proof the trade is wrong. That gap is not a chart-reading problem. It is a decision-making problem, and it is usually the actual reason a technically sound trader is not yet consistently profitable.
Frequently asked questions
Is price action trading better than using indicators?
Neither is inherently better. Price action gives you information without the lag indicators add, since indicators are calculated from price after the fact. Many traders use price action as the primary read and indicators like volume or moving averages as secondary confirmation, rather than choosing one exclusively.
What is the best timeframe for price action trading?
There is no single best timeframe. Higher timeframes like daily and weekly generally produce more reliable signals with fewer false moves, since more capital and more traders are involved. Lower timeframes offer more frequent setups but with more noise. The right choice depends on how much time you can dedicate to watching the market.
Do I need to memorise every candlestick pattern to trade price action?
No. A small set of reliable patterns, rejection candles, engulfing candles, and inside bars, covers most practical situations. Knowing a handful of patterns well and combining them with support, resistance, and trend context works better than knowing forty patterns shallowly.
Can price action trading work without any indicators at all?
Yes, many traders trade purely off candles, structure, and levels. Others add one or two simple tools, like a volume indicator, without cluttering the chart. The core of price action does not require any indicator, but using a small number as confirmation is not a contradiction of the approach.
Why do my price action setups look perfect on the chart but still lose money?
Often the chart reading itself is fine, but execution around the setup breaks down: sizing too large, entering too early before confirmation, or exiting too soon on normal noise. Reviewing a trading journal honestly usually reveals whether the issue is the setup itself or how it was executed.
The real point
Price action trading is a way of listening to what the market is actually doing, through candles, structure, and levels, instead of waiting for a formula to interpret it for you. The tools are learnable in a few months. Trusting yourself to act on them consistently, especially after a couple of losses, takes considerably longer.
The market does not reward better predictions. It rewards better decisions.
Chart padhna seekh sakte ho, lekin usme trust rakhna waqt leta hai.
Related reading:
- Support and Resistance: How to Actually Draw Them
- Volume Analysis: What High and Low Volume Actually Tell You
- Candlestick Patterns: The Complete Guide for F&O Traders
Want the complete course? This fits into Samir Dash’s free Price Action Trading course on this site, a full step by step guide from the basics onward.
Reading a clean price action setup after the fact is easy. Trading it while the candle is still forming and your money is on the line is a completely different skill. I run a free live session twice a week for traders with two or more years of experience who know the setups but still cannot execute under pressure. Register for the next free session here.
I am Samir Dash, founder of Mindful Trading Hub. I work with experienced traders on live market decision-making. More about my story here.