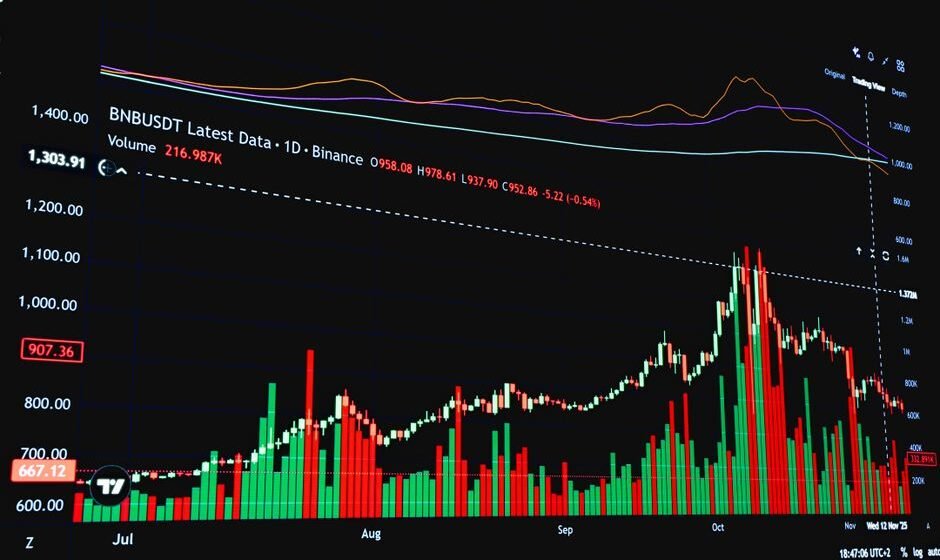

Price tells you what happened. Volume tells you how much conviction was behind it. A breakout on huge volume and a breakout on barely any volume can look identical on a candlestick chart, but they mean very different things about what is likely to happen next.
This post covers how to read volume alongside price, without turning it into its own separate, confusing indicator. Used well, volume is one of the simplest tools available, and one of the most ignored by traders who focus only on price.
What volume actually measures
Volume is simply the number of shares or contracts traded during a given period. On a daily chart, it is the total traded that day. On a 15-minute chart, it is the total traded in that 15-minute window.
Volume by itself does not tell you direction. A candle can close green with high volume, or close red with high volume. What volume tells you is how many traders were actively involved in creating that candle’s price move. A big price move on low volume means relatively few traders pushed price that far, which is a weaker, less convincing move. The same price move on high volume means a large number of traders agreed enough to trade actively, which is a stronger, more convincing move.
Why volume confirms conviction
Think about what it takes to move a stock price. Every trade needs a buyer and a seller. If price is rising quickly on low volume, it often means there simply were not many sellers available at that price, so it did not take much buying to push price up. That kind of move can reverse quickly once real sellers show up.
If price is rising on high volume, it means a large number of buyers were actively stepping in and a large number of sellers were willing to sell into that demand, and buyers still won the fight. That kind of move reflects a genuine shift in who is in control, not just a temporarily thin order book.
This is the core reason volume matters for confirming price action: it tells you whether a move happened because of real, broad participation, or because of a temporary lack of resistance.
Using volume with breakouts
This is where volume earns its keep the most. A breakout above resistance or below support is a moment where a level is being tested seriously, and volume tells you a lot about whether it will hold.
- Breakout on high volume. Suggests real buying or selling pressure is behind the move, and the breakout has a better chance of continuing. This is covered further in the post on real versus fake breakouts.
- Breakout on low volume. A warning sign. Price may have poked through the level without enough real participation to sustain the move, making a quick reversal back into the old range more likely.
A simple habit: before trusting a breakout, glance at the volume bar for that candle compared to the average volume of the last several candles. A breakout candle with volume clearly above that average is a stronger signal than one that barely moves the volume bar at all.
Volume at support and resistance
Volume also helps judge the strength of a support or resistance level itself, not just a breakout of it.
A level formed with high volume during the original move, whether a sharp rally or a sharp fall, tends to be a level more traders are watching and have a stake in. A level formed on a quiet, low-volume day is more likely to be forgotten and less likely to produce a strong reaction later.
This ties directly into the idea of a supply or demand zone, where the strength of the original move, and the volume behind it, is a big part of what makes the zone worth marking in the first place.
A practical way to apply this: when you mark a new support or resistance level, jot down a quick note on whether volume was high, average, or low during the move that created it. Six months later, when price returns to that level, that note tells you far more about how seriously to take the level than the line on the chart alone ever could.
Volume divergence
One useful pattern to watch for is when price and volume start disagreeing with each other.
If Nifty makes a new high, but the volume on that new high is noticeably lower than the volume on the previous high, it can suggest fewer traders are participating in pushing price higher, even though price technically made a new high. This does not guarantee a reversal, but it is a reason to pay closer attention and tighten your risk management, rather than assuming the trend is as strong as it looks.
A simple framework for combining volume with price
- Look at the price move first. What happened, a breakout, a bounce off support, a rejection at resistance?
- Check the volume on the candle or candles involved. Was it clearly above average, roughly average, or below average?
- Weight your confidence in the move accordingly. High volume adds confidence. Low volume should reduce it, not eliminate the setup entirely, but make you demand more confirmation before acting.
- Watch for volume divergence on extended trends, as a signal to tighten stops or take partial profits rather than assuming the trend will continue unchanged.
Common mistakes when reading volume
- Treating volume as a standalone signal. Volume confirms or questions a price move. It is rarely a reason to trade on its own without a price-based setup attached to it.
- Ignoring the time of day. Intraday volume is naturally higher near the market open and close, and lower during the midday lull. Comparing a midday candle’s volume to an opening candle’s volume without adjusting for this can be misleading.
- Overreacting to one low-volume candle. A single quiet candle is not automatically a red flag. Look at the pattern over several candles, not just one.
Here is where this connects to execution. A trader can correctly notice that a breakout came on weak volume and correctly decide to skip the trade or wait for confirmation. That is good chart reading. The harder moment comes an hour later, when price keeps climbing anyway without them, and the discipline to skip a low-quality signal starts to feel like a mistake instead of the right call it actually was. Sticking with a sound process, even when the market makes the excluded trade look good in hindsight, is a decision-making skill, not a charting one.
Frequently asked questions
Do I need a special volume indicator, or is the basic volume bar enough?
The basic volume bar most charting platforms show by default is enough for most price action work. Comparing a candle’s volume to the recent average, roughly by eye, is often sufficient without adding a complex volume indicator on top.
Why does a breakout on low volume often fail?
A low-volume breakout suggests the level was crossed without much real buying or selling pressure behind it, often because there simply was not enough opposing volume at that moment to hold the level, rather than because a large number of traders genuinely shifted their view. Without sustained participation, price can drift back through the level easily.
What does it mean when price makes a new high but volume is falling?
This is called volume divergence. It can suggest fewer traders are actively driving the move higher, even though price technically continues upward. It is a signal to pay closer attention and manage risk more carefully, not an automatic sell signal.
Is volume more useful on intraday charts or daily charts?
Both have value, but daily volume is generally more reliable for judging the significance of a breakout or a level, since it reflects a full session’s worth of participation. Intraday volume needs to be read with awareness of the natural high-low-high volume pattern across the trading day.
Can volume alone tell me which direction price will move?
No. Volume tells you how much conviction is behind a move, not the direction. It must always be read together with the price action itself, since a high-volume candle can close in either direction.
The real point
Volume does not predict the future. It tells you how seriously to take what price is already showing you. A price move backed by strong volume deserves more attention and more confidence than the same move on a quiet day. Reading the two together, instead of price alone, closes one of the more common blind spots in technical analysis.
The market does not reward better predictions. It rewards better decisions.
Volume batata hai kitna dum hai move mein, sirf price nahi.
Related reading:
- Support and Resistance: How to Actually Draw Them
- Volume Analysis: What High and Low Volume Actually Tell You
- Candlestick Patterns: The Complete Guide for F&O Traders
Correctly skipping a low-volume breakout is good analysis. Staying calm an hour later when the market proves you “wrong” for a moment is the harder part. I run a free live session twice a week for traders with two or more years of experience who know the setups but still cannot execute under pressure. Register for the next free session here.
I am Samir Dash, founder of Mindful Trading Hub. I work with experienced traders on live market decision-making. More about my story here.