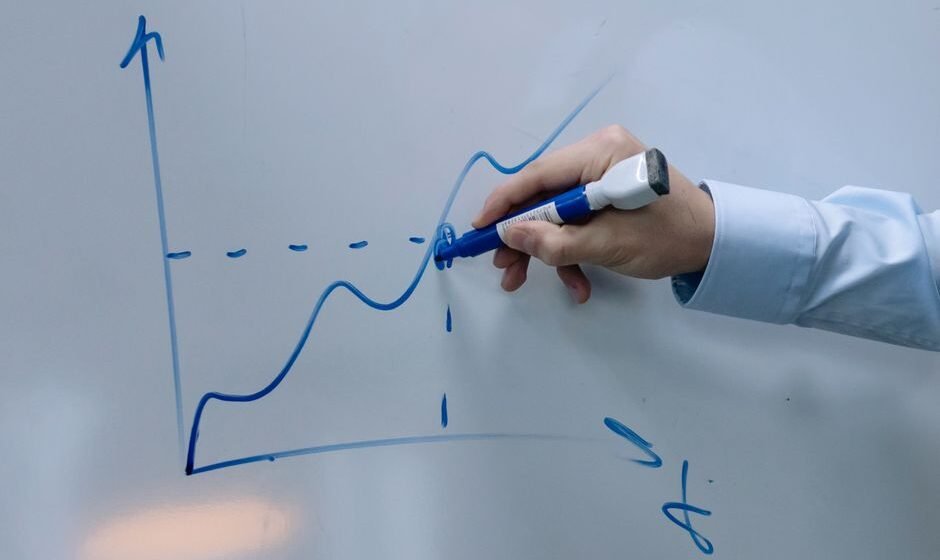

A trendline is a line drawn across a series of price points that shows the general direction the market has been moving, and gives you a level to watch for when that direction might be ending.
An uptrend line connects a series of rising lows. A downtrend line connects a series of falling highs. That sounds simple, and it is, but most traders still draw trendlines that mean almost nothing, because they force a line through points that do not actually belong together. This post covers how to draw a trendline that reflects real market structure, not wishful thinking.
Why trendlines work at all
A trendline is really just support and resistance drawn at an angle instead of a flat price. The same logic from the post on support and resistance applies here.
In an uptrend, each pullback finds buyers at a slightly higher price than the last pullback. That is what makes the lows rise. The trendline connecting those lows is not a magic force, it is a visual summary of buyers becoming more confident and willing to pay more each time. When that pattern of rising lows stops, and a low forms below the trendline, it usually means buyers are no longer willing to defend a rising price, and something has shifted.
The same idea applies to a downtrend line connecting falling highs. Each rally gets sold at a slightly lower price than the last rally, showing sellers gaining confidence.
How to draw an uptrend line correctly
- Find at least two clear swing lows that are rising. A swing low is a point where price stopped falling and turned up, with price higher on both sides of it. You need at least two of these, rising from left to right, before you can draw anything.
- Connect the two lows with a straight line. This is your first draft of the trendline.
- Extend the line to the right and wait for a third touch. A trendline drawn from only two points is a guess. A trendline that gets respected by a third swing low, roughly touching the line without closing far below it, is a real trendline.
- Use candle wicks for the touch, and closes for the break. A wick briefly poking below the line is normal and does not invalidate it. A candle closing clearly below the line is a more serious sign the trendline is breaking.
A downtrend line works the same way in reverse, connecting a series of falling swing highs.
The mistake almost everyone makes
The single biggest error in trendline drawing is forcing a line to fit, instead of letting the line follow price.
Here is what that looks like. A trader wants to believe Nifty is in an uptrend. They pick two low points that are not really connected by any clean structure, draw a line through them, and then have to redraw the line five more times over the next two weeks every time price cuts through it. Each redraw makes the line less meaningful, because it is no longer describing anything real. It is just chasing price after the fact.
A trendline that needs constant redrawing to stay valid was never a good trendline. If you find yourself adjusting a trendline more than once, delete it and wait for cleaner structure to form.
Steep versus shallow trendlines
Not all trendlines carry equal weight, and the angle matters.
- Steep trendlines form during fast, sharp moves. They tend to break more often and more suddenly, because the pace of the move is not sustainable for long. A break of a steep trendline does not always mean the trend is over, sometimes it just means the trend is slowing to a more normal pace.
- Shallow trendlines form during slower, more gradual moves. They tend to be more reliable and their breaks carry more weight, because the trend they represent was already more sustainable.
This is why a trendline break should not be treated as an automatic signal on its own. Understanding what kind of trend it was drawn on tells you how much to trust the break.
Internal trendlines versus the main trendline
Sometimes a market has more than one valid trendline at once. The main trendline connects the major swing points across the whole move. An internal trendline is a smaller, steeper line connecting more recent, closer-together swing points inside that larger structure.
An internal trendline breaking is common and often does not mean much beyond a short pause. Traders sometimes mistake this for a major reversal signal simply because it is the line they drew most recently and are watching most closely. The main trendline, built from the wider, more established structure, carries more weight. When in doubt about which line to trust, favour the one built from more significant, better-spaced swing points over the one that was drawn last night.
What a trendline break actually means
A trendline break means the pattern of rising lows (or falling highs) has stopped. It does not automatically mean the trend has reversed. There are generally three outcomes after a break:
- Reversal. The trend genuinely turns, and price starts making lower highs and lower lows after an uptrend line breaks.
- Consolidation. Price moves sideways for a while after the break, digesting the prior move before deciding a new direction. This is more common than a full reversal.
- Fakeout. Price briefly closes below the line, then quickly reclaims it and continues the original trend. This is why waiting for confirmation matters, which is covered more in the post on telling a pullback from a reversal.
The trendline break tells you attention is warranted. It does not tell you which of the three outcomes is coming. That is where the rest of your analysis, including support and resistance levels and volume, needs to confirm what happens next.
Using trendlines in a trade
A practical way to use trendlines without overcomplicating things:
- In an uptrend, treat the trendline as a dynamic support level. Look for buying opportunities when price pulls back to the line and shows a reaction, similar to how you would trade a flat support zone.
- When the trendline breaks with a clear candle close beyond it, treat that as a warning sign, not an automatic exit or reversal trade. Wait to see whether price consolidates, reverses, or fakes out before committing to a new direction.
- Combine the trendline with a horizontal support or resistance level nearby. A trendline and a flat level meeting at roughly the same price and time is a stronger signal than either alone.
Here is where the chart work and the execution work separate. A trader can draw a perfectly clean trendline, wait patiently for the third touch, and still hesitate to take the trade because the last two trendline trades did not work out. The line was correct both times. The hesitation is a separate problem, and it is usually the bigger one. Chart accuracy does not automatically produce the confidence to act on the chart in real time.
Frequently asked questions
How many touches does a trendline need to be valid?
At minimum two points to draw the line, but a third touch that respects the line is what confirms it is a real trendline and not just two random points connected by a guess.
Should I draw trendlines using candle wicks or closing prices?
Use wicks to identify where the line should sit, since brief pokes beyond the line during a touch are normal. Use closing prices to judge whether the trendline has actually broken, since a close beyond the line is a stronger signal than a wick alone.
What is the difference between a trendline and a channel?
A trendline is a single line connecting swing lows (uptrend) or swing highs (downtrend). A channel adds a second, parallel line on the opposite side of price, connecting the swing highs in an uptrend or swing lows in a downtrend, giving you both a floor and a ceiling for the current trend.
Does a trendline break always mean the trend is reversing?
No. A break can lead to a reversal, a period of sideways consolidation, or a fakeout where price quickly returns to the original trend. Waiting for a confirmed candle close and checking nearby support or resistance levels helps judge which outcome is more likely.
Why does my trendline keep needing to be redrawn?
This usually means the original line was forced through points that did not represent real structure. If a trendline needs frequent adjustment to stay valid, it is better to delete it and wait for a cleaner set of swing highs or lows to form before drawing a new one.
The real point
A trendline is a simple tool that tells you the direction buyers or sellers have been winning in in recent history. Drawing it correctly means letting price tell you where the line goes, not forcing the line to match what you already believe.
The market does not reward better predictions. It rewards better decisions.
Line seedhi honi chahiye, soch tedhi nahi.
Related reading:
- Price Action Trading: A Practical Guide
- Market Structure: How to Read Higher Highs and Lower Lows
- Chart Patterns Every Trader Should Know
Drawing a clean trendline is a skill you can learn in an afternoon. Trusting it enough to act when price actually reaches it is a completely different skill. I run a free live session twice a week for traders with two or more years of experience who know the setups but still cannot execute under pressure. Register for the next free session here.
I am Samir Dash, founder of Mindful Trading Hub. I work with experienced traders on live market decision-making. More about my story here.