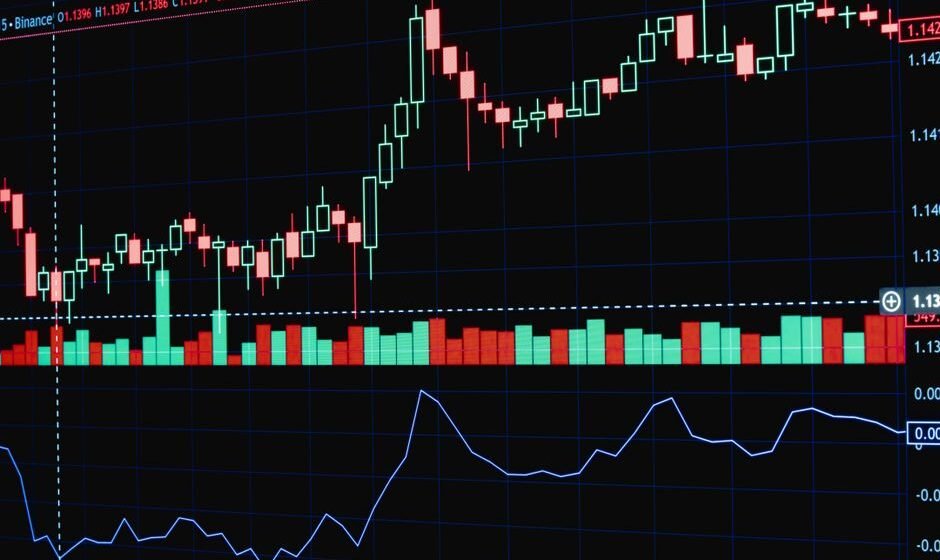

MACD, short for Moving Average Convergence Divergence, measures the distance between two moving averages of price to show you whether momentum is building or fading.
Most traders can recite the rule “buy when MACD crosses above the signal line” without understanding what MACD is actually built from. That gap is exactly why the indicator confuses people. Once you see what is under the hood, the crossovers stop looking like magic and start looking like what they are: a readout of moving averages moving apart and back together.
What MACD is actually made of
MACD is built from three parts, all coming from moving averages you already understand.
- The MACD line: the difference between a 12-period EMA and a 26-period EMA. When the 12-period EMA is above the 26-period EMA, the MACD line is positive. When it is below, the MACD line is negative.
- The signal line: a 9-period EMA of the MACD line itself. It is a smoothed version of the MACD line, moving slightly slower.
- The histogram: the gap between the MACD line and the signal line, drawn as bars. When the bars grow, the gap is widening. When they shrink, the gap is closing.
That is the entire indicator. Two EMAs, the distance between them, and a smoothed version of that distance. Nothing about it is predicting the future. It is a more sensitive way of watching the relationship between a fast moving average and a slow one than staring at both lines directly on the price chart.
Why the distance between two EMAs tells you something
When a fast EMA pulls away from a slow EMA, it means recent price action is accelerating away from the longer-term average. That acceleration is what “momentum” means in this context. When the fast EMA and slow EMA move toward each other again, momentum is decelerating, even if price is still moving in the same direction.
This is the real value of MACD over just looking at two moving averages on the price chart. It converts “how far apart are these two lines” into its own line, which makes it much easier to spot when that distance is expanding or shrinking, and to compare it to prior swings.
Reading the crossover
A MACD crossover happens when the MACD line crosses above or below the signal line.
MACD line crossing above the signal line means the 12-26 gap is widening in the bullish direction faster than its own recent average, read as strengthening upward momentum. Crossing below means the opposite, weakening or reversing momentum.
The same warning applies here as with any moving average crossover: in a sideways, choppy market, MACD line and signal line cross back and forth constantly, generating signal after signal that goes nowhere. MACD is a trend-following, momentum tool. It works best when there is an actual trend for it to measure, not in a market grinding sideways in a tight range.
The zero line matters more than people realise
The MACD line crossing above zero means the 12-period EMA has moved above the 26-period EMA, a broader signal that the medium-term trend has turned up. Crossing below zero means the reverse.
Many traders only watch the MACD-signal crossover and ignore the zero line entirely, but the zero line is arguably the more meaningful piece of information. A MACD-signal crossover that happens while MACD is still well above zero is a pause or acceleration inside an existing uptrend. A MACD-signal crossover that also crosses below zero at the same time is a more serious signal that the underlying trend itself may be turning.
The histogram as an early warning
The histogram often turns before the crossover does. If the histogram bars are shrinking toward zero, even while the MACD line is still above the signal line, momentum is fading before the official crossover confirms it. Traders who watch the histogram get an earlier read on weakening momentum than traders who wait for the full crossover, at the cost of more false alarms, since a shrinking histogram does not always lead to a full crossover.
A worked example on Nifty
Say Nifty has been in a downtrend for three weeks, falling from 25,200 to 24,300. The 12-EMA is below the 26-EMA that whole time, so the MACD line is negative, sitting around minus 60. The signal line, the smoothed version of the MACD line, is also negative, around minus 45.
Now Nifty starts to stabilise. It stops making fresh lows, holds above 24,300 for four sessions, and starts drifting up. The 12-EMA is still below the 26-EMA, so the MACD line is still negative, but it has been rising, moving from minus 60 toward minus 20 as the gap between the two EMAs narrows. Eventually the MACD line crosses above the signal line while both are still below zero. This is an early signal, momentum is improving, but the medium-term trend, as measured by the 12-26 relationship, has not turned yet, since MACD is still negative.
A few sessions later, Nifty pushes through 24,600 with strength, the 12-EMA finally crosses above the 26-EMA, and the MACD line crosses above zero. This second event is the more meaningful one described earlier in this post. The first crossover, while still negative, told you momentum inside the downtrend was fading. The zero-line crossover told you the medium-term trend itself had actually flipped. Traders who only watch the MACD-signal crossover would have reacted to both events the same way. Watching the zero line as well lets you tell a pause from an actual trend change.
Why the histogram leads the crossover
It helps to understand why the histogram often moves first. The histogram is just the MACD line minus the signal line, and the signal line is a 9-period EMA of the MACD line, which means it is always trailing the MACD line by design. When the MACD line starts to flatten or turn before a full crossover happens, the gap between the MACD line and its own trailing average, the histogram, starts shrinking immediately, well before the two lines actually meet and cross. This is the same lag relationship as price and a moving average, just one layer further removed. The histogram is reacting to a change in the MACD line the same way the MACD line reacts to a change in price, except one step ahead of the signal line crossover itself. That is the entire mechanical reason it works as an early warning, not any special predictive property.
MACD divergence
Just like RSI, MACD can diverge from price. If Nifty makes a new high but the MACD line makes a lower high than its previous peak, the up-move is happening on weakening momentum. This works on the same logic as RSI divergence: price is still going one way, but the underlying force behind that move, as measured by the moving average relationship, is fading.
The same caution applies. Divergence is a warning, not a countdown timer. It can persist for a while before price actually reacts.
The execution problem hiding inside MACD
MACD is a slower, smoother indicator than RSI in most cases, which means when it does give you a signal, it tends to be a clearer, more considered one. That should make it easier to act on, not harder. In practice, traders often see a clean MACD crossover confirming a trend they were already watching, and still hesitate, because the last MACD signal on this same stock did not work out, or because the trade means entering after price has already moved.
The indicator is not the obstacle at that point. It already did its job, showing a genuine shift in the moving average relationship. What is missing is a plan, decided in advance, for what you do when the signal actually appears, so that in-the-moment doubt does not override a setup you already trust on paper.
Frequently asked questions
What is the best MACD setting for intraday trading?
The default 12, 26, 9 setting is the most widely used and the most tested by the broader market, which matters because many participants are watching the same numbers. Changing the settings can make the indicator faster or slower but does not make it fundamentally more accurate.
Is MACD better than RSI?
They measure related but different things. RSI is bounded between 0 and 100 and is strong for spotting overbought, oversold, and divergence on a fixed scale. MACD is unbounded and better suited to reading trend strength and momentum shifts through the moving average relationship. Many traders use both together for confirmation.
Why does MACD lag price so much?
Because it is built entirely from moving averages, which are themselves lagging by nature. MACD will always confirm a move after it has already begun to some degree. This is a structural feature of the indicator, not a setting you can fix.
Does MACD work well on Bank Nifty?
It works the same way mechanically on any instrument. Bank Nifty tends to move faster and with sharper swings than Nifty, so MACD crossovers can happen more quickly and with more false signals in choppy sessions, which is worth accounting for in position sizing.
Should I trade every MACD crossover?
No. Crossovers in a sideways market are unreliable. Combine MACD with a basic read of whether the broader trend is actually up, down, or flat, and treat MACD as confirmation rather than a standalone entry trigger.
The real point
MACD is just two moving averages and the distance between them, presented in a way that makes momentum shifts easier to see. Once you understand that, the crossovers stop feeling like signals from nowhere and start reading as exactly what they are.
The harder part was never understanding the lines. It is trusting them enough to act when they line up.
Signal samajhna asaan hai, uspar bharosa karna mushkil.
Related reading:
- VWAP: The Indicator Institutions Actually Use
- Market Structure: How to Read Higher Highs and Lower Lows
- Price Action Trading: A Practical Guide
Understanding what MACD is telling you is the easy part. Trusting a clean signal enough to actually take the trade is where most experienced traders get stuck. I run a free live session twice a week for traders with two or more years of experience who know the setups but still cannot execute under pressure. Register for the next free session here.
I am Samir Dash, founder of Mindful Trading Hub. I work with experienced traders on live market decision-making. More about my story here.