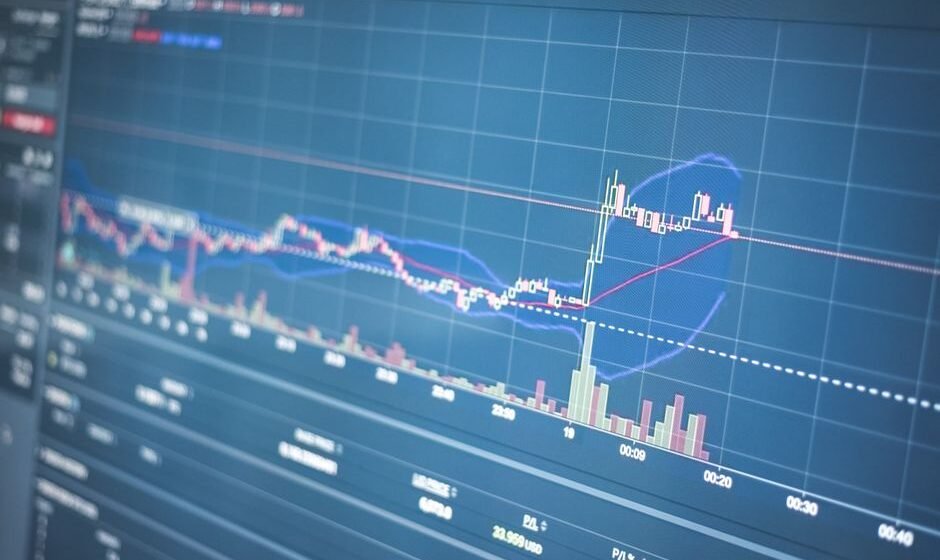

Bollinger Bands measure how much price is currently varying around its own moving average, and plot that variation as two bands above and below the average.
Most traders treat the bands as fixed buy and sell zones: price touches the lower band, buy; price touches the upper band, sell. That is a misreading of what the bands measure, and it is one of the more expensive misreadings in technical analysis, because it works often enough in choppy markets to feel true, then fails hard in trending ones.
What is actually being plotted
A Bollinger Band setup has three lines.
- The middle band: usually a 20-period simple moving average of price.
- The upper band: the middle band plus two standard deviations of price over the same 20 periods.
- The lower band: the middle band minus two standard deviations.
Standard deviation is a measure of how spread out recent prices have been around their average. When recent candles have had large ranges and big moves, standard deviation is high, and the bands sit far apart. When recent candles have been small and tight, standard deviation is low, and the bands squeeze close together.
This means Bollinger Bands are not measuring price level at all. They are measuring volatility, how much price has been moving around, not how far price has traveled or where it “should” reverse.
Why touching a band is not a signal by itself
Because the bands are set at two standard deviations from the average, price touching or briefly moving outside the upper or lower band is a statistically expected event, not a rare or extreme one. In a normal distribution, roughly 5 percent of readings fall outside two standard deviations, which in a market context means band touches happen regularly, especially in a trending market.
In a strong uptrend, price can walk along the upper band for days, touching or slightly exceeding it candle after candle, while the trend continues higher the entire time. A trader who sells every touch of the upper band in that stretch is fighting a strong trend based on a misunderstanding of what the band touch means. The band is saying “price is moving with high variance in the up direction,” not “price has gone too far and must reverse.”
The squeeze: where the bands genuinely earn attention
The more reliable signal from Bollinger Bands is not a touch. It is a squeeze, when the bands contract tightly together after a period of low volatility.
A squeeze means price has been moving in a very narrow range for a while, standard deviation is low, and the bands have pulled in close to the middle average. Periods of low volatility are frequently followed by periods of higher volatility, because markets do not stay quiet indefinitely. Big moves are often preceded by quiet, tight consolidation as positions build up before a breakout.
This is why traders watch for a squeeze as a setup, not a signal to enter immediately, but a signal that a bigger move is becoming more likely soon, in either direction. The squeeze does not tell you which way price will break. It tells you volatility is compressed and likely to expand.
Reading the breakout after a squeeze
When price finally breaks out of a squeeze, the bands begin to widen again as the move gains size. Traders typically wait for a candle to close clearly outside the band, combined with rising volume, before treating the squeeze as resolved in that direction. Entering on the first small poke outside the band, before the move has actually confirmed, is a common way to get caught in a false breakout that snaps back into the range.
Bollinger Bands in a ranging market
In a genuinely sideways, range-bound market, without a squeeze forming, the bands behave differently again. Here, price bouncing between the upper and lower band, with the middle band roughly flat, can be a workable mean-reversion setup: buying near the lower band and selling near the upper band, inside a range that is not trending. The key condition is that the middle band itself needs to be flat, confirming there is no real trend underway. Applying this same bounce logic inside a trending market, where the middle band is clearly sloping, is exactly the mistake described earlier.
A worked example on Nifty
Say Nifty has been stuck between 24,600 and 24,750 for eight sessions. The middle band, the 20-day SMA, is flat around 24,670. The upper band has drifted down to 24,780 and the lower band has drifted up to 24,560, a gap of only 220 points between them, much tighter than the 500 to 600 point gap the bands normally hold during a trending stretch. This is a squeeze.
On the ninth session, Nifty prints a strong candle that closes at 24,830, clearly outside the upper band, on volume noticeably higher than the previous week. This is the confirmed breakout described earlier, a close outside the band plus volume, not just a brief poke above it. Over the next several sessions, Nifty pushes to 25,100, and the bands widen out again as the 20-day standard deviation catches up with the larger recent candles. A trader who waited for the confirmed close and volume, rather than jumping in on the first small tick above 24,780, caught the same move with far less risk of getting caught in a false break that snapped back into the 24,600-24,750 range.
Now compare a different case. Nifty pokes slightly above 24,780 intraday, touching 24,790, but closes the session back inside the range at 24,720, on ordinary volume. That is not a confirmed breakout. It is a wick outside the band that failed to hold. A trader who bought the moment price touched 24,790, without waiting for the close, would have entered right before the reversal back into the range.
Why the mean-reversion bounce actually works in a flat range
It helps to understand the mechanism behind the range-bound bounce strategy, not just the rule. When the middle band is flat, it means the 20-day average itself is not trending, so the standard deviation being added and subtracted around it is measuring noise around a stable centre, not variance around a moving target. In that condition, a touch of the lower band genuinely represents price stretched further from its own short-term average than usual, with no trend to justify staying stretched, so a reversion back toward the middle band is the more statistically normal outcome. In a trending market, the middle band itself is moving, so a touch of the upper band does not represent an unusual stretch relative to a moving target, it represents price simply keeping pace with a rising average. That is the entire reason the same touch means something different depending on whether the middle band is flat or sloped, and it is worth actually checking the slope of the middle band before treating any band touch as a signal.
Why this matters for Nifty and Bank Nifty options traders
Volatility is not an abstract concept for F&O traders, it directly affects options premium through implied volatility. A Bollinger Band squeeze on the underlying index is a rough visual cue that realised volatility has been low, which often lines up with cheaper option premiums. When the squeeze resolves and volatility expands, premiums tend to expand with it. Traders who buy options specifically expect this kind of expansion, so reading the bands as a volatility gauge, not just a price gauge, connects directly to the decisions options traders are already making around premium.
The execution gap with Bollinger Bands
The squeeze setup looks obvious in hindsight on every textbook chart. In real time, sitting through a multi-day squeeze with a narrow range and nothing happening is genuinely boring, and traders often abandon the setup out of impatience right before it resolves, or jump in on the first small move before the actual breakout confirms. Reading the volatility contraction correctly is the technical skill. Sitting through the waiting period without forcing an entry is the decision-making skill, and it is usually the one that decides whether the setup actually pays off.
Frequently asked questions
Do Bollinger Bands predict which direction price will break?
No. A squeeze tells you volatility is compressed and a bigger move is likely coming. It does not tell you the direction. Traders wait for a confirmed close outside the band, usually with volume, before taking a directional view.
What settings do traders normally use?
The standard default is a 20-period moving average with bands set at two standard deviations. This is the most widely used setting and the one most other market participants are also watching.
Can Bollinger Bands be used on intraday charts?
Yes, the same logic applies on any timeframe. On very short timeframes like 1-minute charts, the bands react faster and squeeze and expand more often, which can generate more false signals if used without a broader trend read.
Is buying at the lower band and selling at the upper band a reliable strategy?
Only in a genuinely range-bound market with a flat middle band. In a trending market, price can ride along one band for an extended stretch, and fading every touch will produce repeated losses against the trend.
How is a Bollinger Band squeeze different from low ATR?
Both measure volatility contraction, but through different math. Average True Range measures the average size of price ranges directly. Bollinger Bands measure standard deviation around a moving average. In practice they tend to agree, and many traders use both to confirm the same low-volatility reading.
The real point
Bollinger Bands are a volatility gauge wearing the appearance of a buy and sell zone. Once you read them as volatility, the squeeze and the trend-riding upper band both make sense as the same underlying mechanism, price variance expanding and contracting.
Spotting the squeeze correctly is technical analysis. Sitting through the quiet, boring days without forcing a trade is something else entirely.
Volatility ka pattern samajh aa gaya, patience ka kya?
Related reading:
- VWAP: The Indicator Institutions Actually Use
- Market Structure: How to Read Higher Highs and Lower Lows
- Price Action Trading: A Practical Guide
Spotting a genuine volatility squeeze on the chart is one thing. Sitting through the boring, quiet days without forcing an early entry is where most traders actually lose the trade. I run a free live session twice a week for traders with two or more years of experience who know the setups but still cannot execute under pressure. Register for the next free session here.
I am Samir Dash, founder of Mindful Trading Hub. I work with experienced traders on live market decision-making. More about my story here.