


Bollinger Bands: What They Actually Show You

Bollinger Bands are not a buy-low sell-high tool. What the bands actually measure, why they widen and squeeze, and how to read them properly.
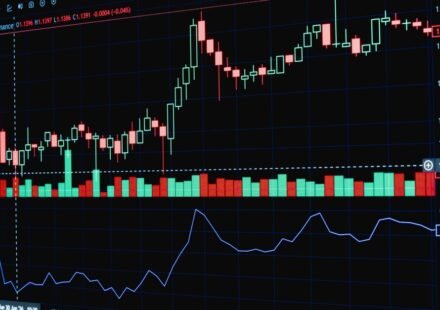
MACD Indicator Explained Simply
MACD confuses most traders because they never learn what it is built from. A simple explanation of what MACD calculates and how to read it.

RSI Indicator: How to Read It Without Getting Fooled
RSI is not just "overbought above 70, oversold below 30." What RSI actually measures, how traders misread it, and how to use it correctly.
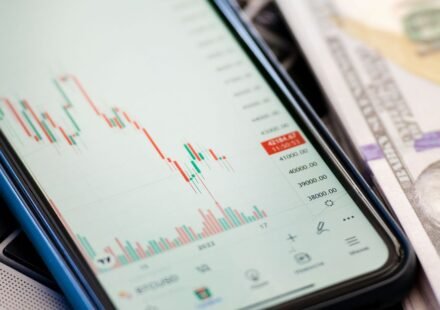
Moving Averages: How Traders Actually Use Them
Moving averages look simple but most traders misread them. What a moving average is actually calculating, how to read it, and where it fails.

Multi-Timeframe Analysis: How to Use It Without Overcomplicating
Multi-timeframe analysis does not need five charts open at once. Here is a simple, practical way to use it that actually helps your trading.

Pullback vs Reversal: How to Tell the Difference
A pullback and a reversal look the same at first. Here is how to tell which one you are actually looking at, and what to do differently for each.

Breakout Trading: How to Tell a Real Breakout from a Fake One
Fake breakouts trap more traders than any other pattern. Here is how to tell a real breakout from a fake one before you commit capital.
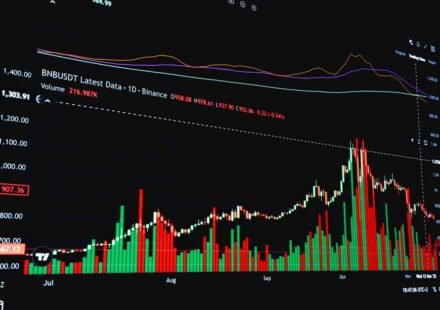
How to Read Volume Alongside Price Action
Price tells you what happened. Volume tells you how convinced the market was. Here is how to read the two together correctly.
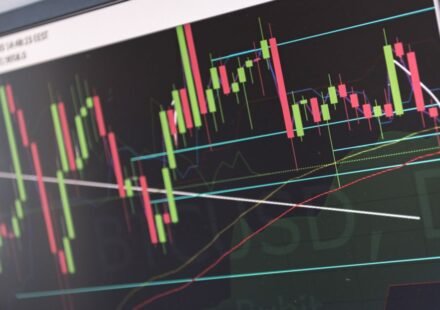
Price Action Trading: A Practical Guide
Price action trading explained without the jargon. What it actually means, the core building blocks, and how to build a simple plan around it.
Round Number Psychology: Why Prices Stall at 100, 200, 500
Why do stocks and indices keep stalling at round numbers like 24,000 or 500? The real reason is human behaviour, not the market.