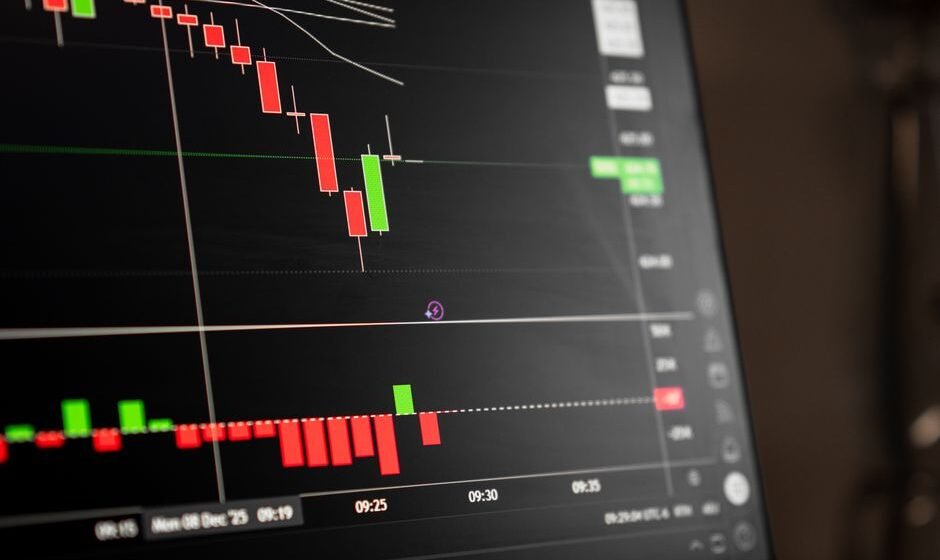

A candlestick is a small picture of a fight. On one side are the buyers pushing price up. On the other side are the sellers pushing it down. The shape of the candle tells you who won that fight, and how easily.
This is the pillar guide to candlestick patterns. It covers how a candle is built, what the basic shapes mean, the most useful patterns for F&O traders, and how to use them without treating them as magic.
What a candlestick actually shows you
Every candle, on any timeframe, records four prices: the open, the high, the low, and the close.
- Open is the first traded price in that period.
- Close is the last traded price in that period.
- High is the highest price reached.
- Low is the lowest price reached.
The thick part of the candle is called the body. It runs from the open to the close. If the close is higher than the open, the body is usually shown green or white, and the candle is called bullish. If the close is lower than the open, the body is red or black, and the candle is bearish.
The thin lines above and below the body are called wicks or shadows. The upper wick shows the highest point price reached before sellers pushed it back down. The lower wick shows the lowest point before buyers pushed it back up.
Once you can read these four numbers in a shape, you are reading the candle correctly. Everything else in this guide is just naming common shapes and explaining what kind of buyer or seller behaviour produces them.
Why the shape matters, not just the color
New traders often look only at color. Green means good, red means bad. That is not enough information.
What matters more is the size of the body compared to the wicks, and where the body sits inside the candle’s full range. A candle can close green and still be a warning sign, if it has a long upper wick showing that sellers pushed back hard before the close. A candle can close red and still show strength, if buyers defended a big drop and the body is small near the top.
Think of the wick as a record of rejection. Price tried to go there and could not stay. The longer the wick, the stronger the rejection at that level.
The main single-candle patterns
These are patterns you can see on one candle alone.
Doji
A doji has a very small or non-existent body, with the open and close almost equal. It sits in the middle of a range with wicks on both sides, or has wicks of different lengths. It shows that buyers and sellers fought to a draw during that period. Full detail in Doji Candlestick Pattern: What It Really Means.
Hammer and hanging man
Both have a small body near the top of the candle’s range and a long lower wick, at least twice the length of the body. A hammer appears after a downtrend and suggests buyers stepped in hard at the low. A hanging man is the identical shape but appears after an uptrend, and suggests sellers are starting to test the highs. Full detail in Hammer and Hanging Man Candlestick Patterns Explained.
Marubozu
A marubozu has almost no wick at all. The body runs from open to high (or close to it) and from low to close, with one side driving the whole session. It shows one side was in full control from open to close, with no meaningful pushback. Full detail in Marubozu Candle: What It Tells You About Momentum.
The main two-candle patterns
Some of the most reliable signals need two candles read together, because they show a change in control, not just one session’s behaviour.
Engulfing pattern
A bullish engulfing candle has a body that fully covers the body of the previous red candle. It means buyers did not just stop the decline, they reversed it entirely within one session. A bearish engulfing candle is the mirror image. Full detail in Engulfing Candlestick Pattern: Bullish and Bearish.
Piercing line and dark cloud cover
A piercing line opens below the previous candle’s low and closes above its midpoint, showing a sharp recovery inside one session. Dark cloud cover is the bearish mirror, opening above the previous high and closing below the midpoint.
Why these shapes actually mean something
It helps to remember that every candle is built from thousands of individual trades. A long lower wick on a Nifty 15-minute chart is not decoration. It means real money pushed price down to that level, and then real money bought it back up before the candle closed. Somebody with size decided that price was too cheap to leave alone.
This is why patterns tend to matter more at meaningful levels, like a previous swing low, a round number like 24,800, or a support zone that has held before. A hammer in the middle of nowhere is just a candle. A hammer sitting exactly on a level that held three times in the last month is a candle with context.
How to actually use candlestick patterns
Here is the part most guides skip. A candlestick pattern is not a signal to enter on its own. It is a signal to pay attention.
- Note the pattern. A hammer forms on Nifty near 24,800, a level that has acted as support before.
- Wait for confirmation. Does the next candle hold above the hammer’s low? Does volume pick up on the move away from the level?
- Define your risk before entry. If you act on the hammer, your stop usually sits just below its low. If price trades back through that low, the pattern failed.
- Size the trade to the stop distance. Not to how confident the pattern makes you feel.
Candlestick reliability is genuinely debated among traders and researchers. Nobody has a clean, trustworthy win rate for any of these shapes, and you should be suspicious of anyone who quotes you one. Treat a pattern as a reason to look closer, not a reason to click buy.
Common mistakes traders make with candlestick patterns
- Trading a pattern on a low timeframe (like a 1-minute chart) where noise creates dozens of “patterns” a day that mean very little.
- Ignoring the location. The same hammer means different things at a random price versus at a tested support level.
- Treating a pattern as a guarantee instead of a prompt to watch the next one or two candles.
- Not defining a stop before entering, so the trade has no clear invalidation point.
Knowing the pattern is not the same as acting on it
Here is the part that generic technical analysis content usually leaves out. You can look at a chart, correctly identify a bullish engulfing candle at support, and still not take the trade. You freeze, or you wait one candle too long, or you take it and then close it early out of nerves. The knowledge was right. The execution wasn’t. Reading price action well and acting on it under pressure are two different skills, and most experienced traders are missing the second one, not the first.
Frequently asked questions
What is the most reliable candlestick pattern?
There is no single pattern that works reliably on its own. Engulfing patterns and hammers tend to get more attention because they show a clear shift in control within the candle, but every pattern needs the right location and confirmation to mean much. Be wary of anyone promising a fixed win rate.
Do candlestick patterns work on all timeframes?
They appear on every timeframe, but they carry more weight on higher timeframes like daily and 15-minute charts than on 1-minute charts, where random noise produces similar shapes constantly.
How many candlestick patterns do I actually need to know?
Fewer than most courses suggest. Doji, hammer, engulfing, and marubozu cover the core logic of indecision, rejection, reversal, and momentum. Once you understand why each of those forms, most other named patterns are variations on the same four ideas.
Should I trade candlestick patterns alone, without other tools?
It is not advisable. Patterns work better combined with a support or resistance level, a trend context, and a plan for where you are wrong. A pattern alone tells you what happened in one or two sessions, not where price is headed next.
Why do candlestick patterns fail so often?
Because a pattern shows what happened in the past, not what will happen next. It reflects a moment of buyer or seller behaviour, and markets can absorb that behaviour and move differently a candle later. This is exactly why confirmation and a defined stop matter more than the pattern itself.
Where to go from here
Candlestick patterns are the alphabet of price action. Once you can read them without effort, you start seeing the story a chart is telling, not just a random sequence of red and green bars. That reading skill is genuinely useful. What separates traders who profit from it isn’t who reads the candle best. It’s who can act on what they read, calmly, trade after trade.
Chart padhna aasan hai, usme trade lena mushkil.
Related reading:
- Chart Patterns Every Trader Should Know
- Advanced Candlestick Patterns: Multi-Candle Formations Explained
- Price Action Trading: A Practical Guide
Want the complete course? This fits into Samir Dash’s free Candlestick Patterns course on this site, a full step by step guide from the basics onward.
Knowing the pattern is one thing. Trading it under pressure is another. I run a free live session twice a week for traders with two or more years of experience who know the setups but still cannot execute under pressure. Register for the next free session here.
I am Samir Dash, founder of Mindful Trading Hub. I work with experienced traders on live market decision-making. More about my story here.