

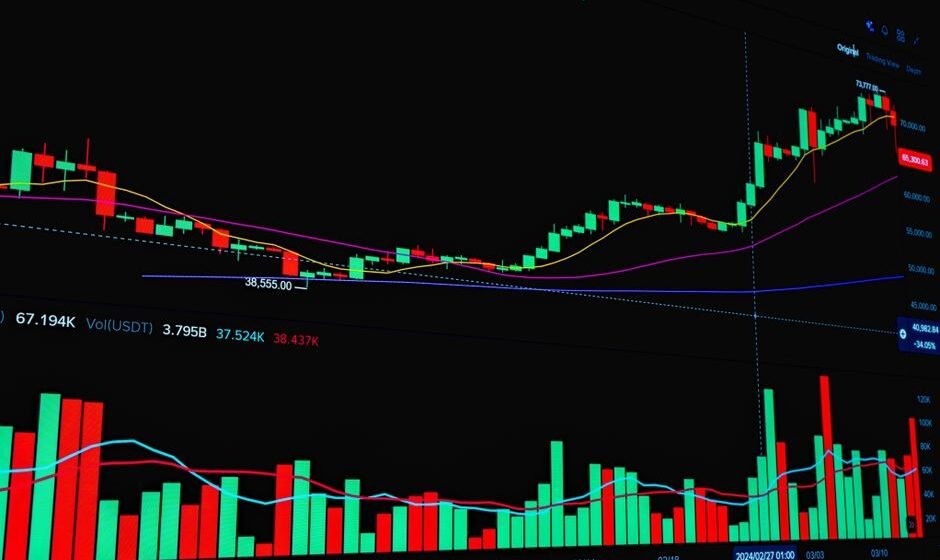

Large cap stocks fall. Midcap and smallcap stocks tend to fall harder, often by a wide margin. This pattern showed up again during the week of October 19 to 23, 2026, when the Sensex and Nifty fell around 2 percent while the Nifty Midcap 100 and Nifty Smallcap 100 fell much more. This post explains the structural reasons behind that pattern, in plain terms.
The Numbers From the Recent Correction
During that week, the BSE Sensex was reported down about 2.15 percent and the Nifty 50 down about 2.36 percent. The Nifty Midcap 100 was reported down about 5.63 percent, and the Nifty Smallcap 100 was reported down about 7.27 percent. In other words, smaller stocks lost roughly two to three times as much as the large cap benchmarks that week. You can read more about the full picture of that correction, including the reported causes, in what is actually happening with the midcap and smallcap correction.
This was not a one off coincidence specific to that week. It reflects a structural pattern that tends to repeat during most broad market corrections, which is worth understanding well beyond this single event.
Liquidity Is the Core Reason
Large cap stocks are traded in much higher volume than most midcap and smallcap stocks. That means there are usually more buyers and sellers active at any given moment, which helps keep price moves smoother. Midcap and smallcap stocks often have fewer active participants, so when sellers show up in a hurry during a correction, there may not be enough buyers nearby to absorb that selling without a bigger price drop. This gap between the number of active participants in large versus smaller stocks is the single biggest reason behind the pattern.
Institutional Money Moves First Through Large Caps
During a selloff, big institutional investors, including foreign institutional investors, often reduce exposure first in large, liquid stocks, simply because those are the easiest positions to exit quickly without moving the price too much. Smaller stocks can lag in the first wave of selling, then catch a bigger wave later as the broader risk off mood spreads and as retail investors, who hold a larger share of midcap and smallcap stocks compared to large caps, start exiting too. This chain reaction can amplify the downside in smaller names well after the initial trigger has already shown up in the large cap indices.
Retail Concentration Adds Extra Swing
Midcap and smallcap stocks tend to have a higher proportion of retail ownership compared to large caps, which are more heavily held by institutions. Retail investors, as a group, often react more emotionally to volatility, and that collective behavior can add extra swing to prices in both directions, not just during corrections but during rallies too. This is one reason midcap and smallcap indices often also rise faster than large caps during strong up moves, not just fall faster during down moves. The pattern cuts both ways.
Why Volatility Measures Matter More Here
India VIX measures expected volatility primarily based on Nifty options, which track large cap exposure. It does not directly measure expected volatility in midcap or smallcap stocks specifically. During the correction window, VIX was reported to have risen to around 16.86, which already signals rising uncertainty at the large cap level. Given that midcap and smallcap stocks tend to move with greater amplitude than large caps, the practical volatility experienced in those smaller stocks during the same period is often higher still, even without its own dedicated index number to point to. For more on reading VIX itself, see the India VIX spike article.
What This Means for Position Sizing
If you hold midcap or smallcap positions, it is worth building the habit of sizing those positions smaller than you would a comparable large cap position, precisely because the expected range of movement is typically wider. A stop loss distance that feels comfortable on a large cap stock may get hit far more often, and with sharper slippage, on a midcap or smallcap name during a volatile period. Adjusting for this difference ahead of time, rather than discovering it the hard way during a sharp correction, is a simple and practical form of risk management.
A Pattern Worth Remembering, Not Predicting From
Understanding why midcap and smallcap stocks fall harder during corrections does not tell you when the next correction will happen, or how deep it will go. This article does not make that prediction. What this pattern does give you is a more realistic expectation for how your portfolio composition affects your experience during stressful market weeks, so you are less surprised and less likely to react emotionally when it happens again.
A Useful Habit for Checking Your Own Portfolio Mix
If you hold a mix of large cap and midcap or smallcap stocks, it is worth periodically checking what share of your total portfolio each category actually represents, since this can drift over time without you noticing, especially after a strong rally in smaller stocks quietly increases their weight in your overall holdings. A portfolio that started out fairly balanced can end up heavily tilted toward the more volatile end without any deliberate decision behind that shift, simply because of how prices moved. Reviewing this mix every few months, rather than only during a stressful correction week, gives you the chance to rebalance calmly rather than under pressure.
This kind of periodic check is a simple, low effort habit, but it directly addresses the structural pattern described above, since it keeps your actual exposure to the more volatile part of the market closer to a level you chose deliberately, rather than one that built up by accident.
Frequently Asked Questions
Do midcap and smallcap stocks always fall harder than large caps?
Not always, but it is a common pattern during broad market corrections, due to lower liquidity and higher retail concentration in smaller stocks. The same dynamics can also make them rise faster during strong rallies.
Does lower liquidity in smallcap stocks make them bad investments?
Lower liquidity is one risk factor to be aware of, among several others, but this article does not make any recommendation about specific stocks or categories of stocks.
Should I avoid midcap and smallcap stocks entirely because of this pattern?
This article does not recommend any specific allocation or investment decision. Understanding the risk pattern is meant to inform your own risk management, not to tell you what to buy or avoid.
Is this investment advice?
No. Samir Dash is not SEBI-registered, and this article shares general risk and psychology concepts, not a recommendation about any specific product, provider, or strategy. Please read the Disclaimer before acting on anything you read here.
Chhoti naav tez hilti hai, sambhal kar chalana padta hai.
Does your position size already account for how much harder smaller stocks swing during a correction? I run a free live session twice a week for traders with two or more years of experience who know the setups but still cannot execute under pressure. Register for the next free session here.
I am Samir Dash, founder of Mindful Trading Hub. I work with experienced traders on live market decision-making. More about my story here.