

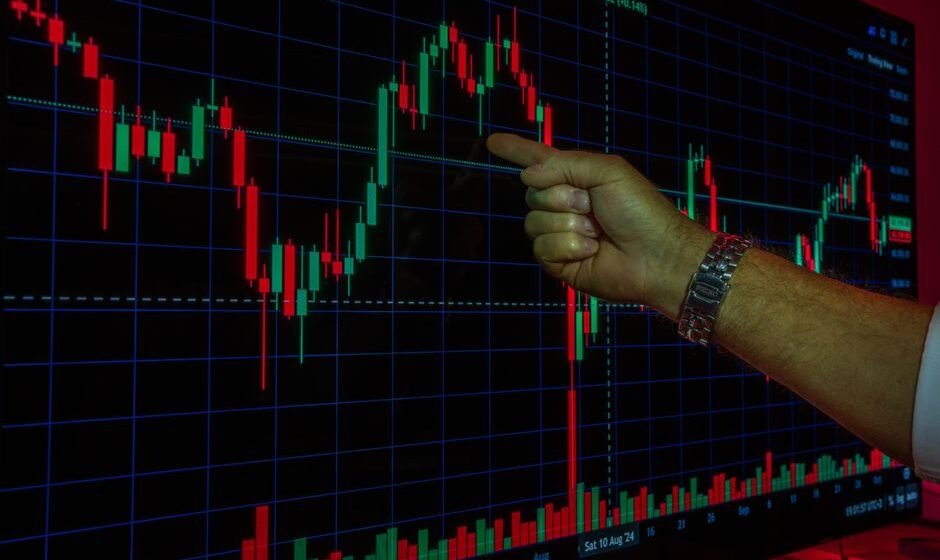

If your portfolio looked worse than the Nifty headline number during the week of October 19 to 23, 2026, you are not imagining it. The broader market fell much harder than the main index that week, and a lot of traders felt the pain without understanding why.
This post explains what was reported about that correction, in plain numbers, and separates what is broadly agreed from what is still unclear. It also talks about why midcap and smallcap stocks tend to move harder than large caps during any selloff, which is a pattern worth understanding long after this particular week is forgotten.
What the Headline Numbers Showed
During that week, the BSE Sensex was reported to have fallen about 2.15 percent, closing around 73,123. The Nifty 50 was reported to have fallen about 2.36 percent, closing around 22,600. Those are not small moves for one week, but they are nowhere near as sharp as what happened underneath the surface.
The Nifty Midcap 100 was reported down about 5.63 percent that week. The Nifty Smallcap 100 was reported down about 7.27 percent. In other words, smaller company stocks lost more than double, and in some cases more than triple, what the large cap index lost. This is the real story of that week, not the headline Sensex or Nifty number.
What Was Reported as the Cause
Several reasons were reported across different sources for this correction. These sources are secondary blogs and news reports, not direct exchange data, and the exact figures and emphasis vary from one source to another, so treat this as a reported picture rather than a confirmed, final account.
The reasons commonly cited include rising crude oil prices, weak global markets, continued selling by foreign institutional investors, and mixed Q2 FY27 earnings from Indian companies. Some sources also pointed to escalating tensions in the Middle East and weak earnings from banking stocks as contributing factors. One bright spot repeatedly mentioned was IT stocks, which reportedly held up better than the rest of the market that week. For more on how the earnings angle fits in, see what to watch in Q2 FY27 earnings season.
What India VIX Was Showing
India VIX, which measures how much volatility the market expects in the near term, was reported to have risen to around 16.86 during this period. A rising VIX usually means more traders are expecting bigger swings ahead, which tends to go hand in hand with falling prices and nervous selling. This is covered in more depth in the India VIX spike article, but the short version is that a VIX move like this usually reflects fear building up in the system, not a specific prediction about direction.
Why Does This Matter If You Are Not a Midcap or Smallcap Trader
Even if your own trades are mostly in large cap names or index futures, a correction like this still matters to you. It changes the mood of the whole market. Sentiment tends to flow from smaller stocks into bigger ones during a selloff, as nervous money looks for perceived safety. It can also widen bid ask spreads and increase slippage even on liquid names, because market makers themselves get more cautious when volatility rises.
It is also a good moment to notice your own behavior. Did you check your portfolio more often that week than usual? Did you feel an urge to exit positions that had nothing to do with the actual news? These reactions are worth noticing, because they tell you more about your own trading psychology than any single week of index numbers ever will.
What This Correction Does Not Tell You
It is tempting to read a sharp correction like this and immediately look for a prediction about what comes next. Resist that urge. A one week move, even a sharp one, does not tell you whether the broader market has more downside ahead or whether it is close to a turning point. Nobody, including this article, can responsibly tell you that in advance.
What a correction like this is actually useful for is testing your own process. Did your stop losses work the way you expected? Did you follow your own risk rules, or did fear push you into decisions you would not normally make? Those are the questions a week like this is good for answering, far more than any question about where the index goes next.
How to Read News Like This Going Forward
Whenever you read a market correction story, separate three things in your head: the actual index numbers, which are usually fairly reliable since they come from the exchanges; the reported causes, which are often a mix of real factors and after the fact storytelling; and any implied prediction about what happens next, which should be ignored no matter how confident it sounds. Treating these three categories differently will make you a much calmer reader of financial news.
How to Track a Correction Without Obsessing Over It
A useful habit during any correction is to check the numbers at a set time once a day, rather than refreshing them constantly through the day. Constant checking does not give you more useful information, since the index does not finish forming its daily picture until the session closes. What constant checking does give you is a steady drip of small emotional jolts, both up and down, that add up to real stress over a stressful week without adding any real decision making value.
It also helps to write down, before the week even starts, what specific levels or conditions would actually change your plan. If nothing on your list has been triggered, a scary headline on its own is not a reason to act. This kind of simple pre commitment is one of the most effective tools against overreacting to a correction while it is still unfolding.
Frequently Asked Questions
How much did the Nifty Midcap and Smallcap indices fall that week?
The Nifty Midcap 100 was reported down about 5.63 percent and the Nifty Smallcap 100 was reported down about 7.27 percent during the week of October 19 to 23, 2026. These are reported figures from secondary sources and may be refined later.
Was the FII selling the main cause of the fall?
FII selling was one of several reasons reported alongside rising crude oil prices, weak global markets, and mixed earnings. No single cause can be confirmed as the main one from the information available, so it is more accurate to describe it as a combination of pressures.
Does this mean the market will keep falling?
No. A one week correction, even a sharp one, does not predict future direction. This article does not make any prediction about what the market does next.
Is this investment advice?
No. Samir Dash is not SEBI-registered, and this article explains publicly reported event details, not a recommendation about any specific product, provider, or strategy. Please read the Disclaimer before acting on anything you read here.
Chhoti lehar bhi doob sakti hai agar pakad dheeli ho.
Noticed your own reactions getting sharper than the market’s actual moves during a correction like this? I run a free live session twice a week for traders with two or more years of experience who know the setups but still cannot execute under pressure. Register for the next free session here.
I am Samir Dash, founder of Mindful Trading Hub. I work with experienced traders on live market decision-making. More about my story here.