

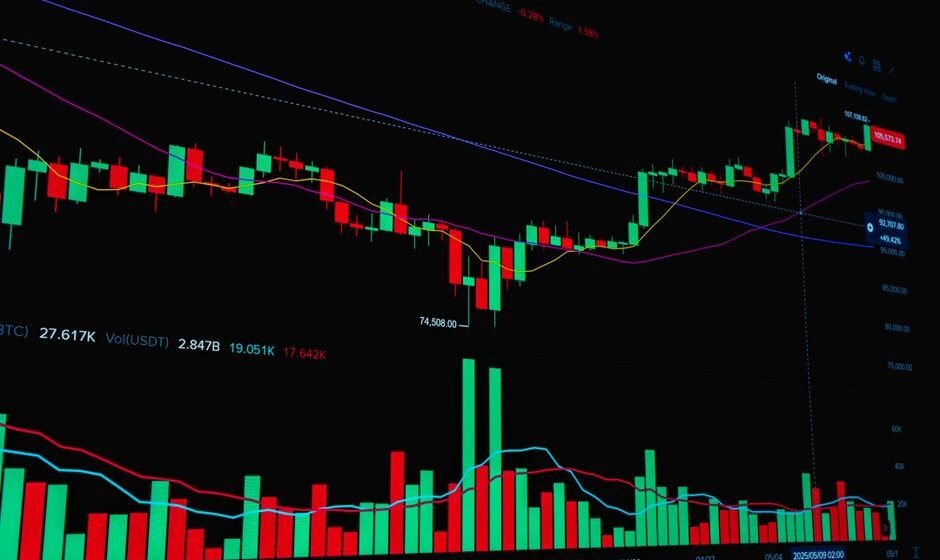

Harami means pregnant in Japanese, and the pattern is named for exactly what it looks like: a small candle sitting inside the body of a much larger candle, the way a smaller shape sits inside a bigger one. It is a two-candle pattern that signals momentum compressing suddenly after a strong move.
This guide covers how the harami forms, what it tells you about the shift from strong conviction to hesitation, and how to trade it without overreacting to it.
What a harami looks like
A harami always has two candles.
- Candle one is large, with a long body, showing one side clearly in control during that session.
- Candle two is small, and its entire body, both open and close, sits inside the body range of candle one. It does not need to stay inside the wicks, just inside the body.
A bullish harami forms after a downtrend: a long red candle followed by a small candle, often green, fully contained inside it. A bearish harami forms after an uptrend: a long green candle followed by a small candle, often red, fully contained inside it.
Harami cross
When candle two is a true doji, with the open and close almost exactly equal, the pattern is called a harami cross. This version is generally read as showing even sharper indecision than a regular harami, since the second candle shows a complete standoff rather than just a smaller move.
Why a contained candle means something
Picture candle one. It is a long red candle, meaning sellers pushed price down hard and closed near the low, with real conviction behind the move. Anyone watching that candle close would expect the next session to continue lower.
Instead, candle two opens inside that range and cannot even reach a new low, let alone extend the move. It trades in a tight band and closes back inside the previous candle’s body. That is a sharp change. The side that dominated the previous session suddenly cannot make any further progress. It does not mean the other side has taken over yet, only that the dominant side has lost its grip. This is why a harami is read as an early warning of a possible turn, rather than a confirmed reversal like an engulfing candle or a completed morning star.
Think of candle one as a punch that lands clean, and candle two as the other side absorbing it and not falling down, without yet punching back. That is compression, not confirmation. Confirmation, if it comes, shows up in the candles after the pattern.
A worked example on Nifty
Say Nifty is in a clear uptrend, moving from 24,300 to 24,900 over ten sessions. On the eleventh session, price opens at 24,850 and closes at 25,050, a strong green candle with almost no wick, showing buyers firmly in control.
On the twelfth session, price opens at 24,950 and closes at 24,980, a small green candle whose entire range sits inside the body of the eleventh candle. This completes a bearish harami.
On its own, this does not mean sell immediately. It means the strong buying from session eleven suddenly stalled. A trader watching this would look for confirmation over the next one or two sessions, a red candle that closes below the low of the harami, or a break of a nearby support level like 24,900, before treating the pattern as an actual reversal signal. If session thirteen opens at 24,960 and closes at 24,700, breaking below the pattern’s range, that confirms the stall was real and gives a much stronger case for the trend turning, with a stop placed above the high of session eleven.
Why harami needs confirmation more than most patterns
Compared to an engulfing pattern or a completed morning star, the harami is a weaker standalone signal. An engulfing candle shows the new side actively reversing the old move within one session. A harami only shows the old side failing to continue. That is a real difference. Failing to continue is not the same as being defeated.
This is why experienced chart readers treat a harami as a flag to watch closely rather than a trade trigger by itself. The pattern earns the right to be traded only after the next one or two candles confirm the stall is turning into an actual reversal.
How to actually trade a harami
- Spot the pattern. A long candle followed by a small candle fully contained inside its body.
- Check the trend and location. Is this happening after an extended move, near a level that has mattered before?
- Wait for confirmation. A close beyond the harami’s range in the new direction, ideally with a pickup in volume.
- Place your stop beyond the extreme of candle one, since a return past that point invalidates the whole idea.
There is no dependable win rate for the harami pattern, and treating it as an automatic signal without confirmation is one of the more common mistakes traders make with it. It is a flag, not a trigger.
Harami versus a normal inside candle
It is worth being precise here, because not every small candle after a big candle is a meaningful harami. A tiny doji forming inside a huge candle after a quiet, low-volume session is a very different event from a small candle forming inside a huge candle after a session with real, elevated participation. The shape can look identical on the chart, yet one reflects a genuine standoff between engaged buyers and sellers, and the other reflects a market that simply had nothing much happening that day.
This is why checking volume on the second candle adds real value. A harami’s small candle on average or below-average volume is a weaker version of the pattern. A harami’s small candle on volume similar to or higher than candle one, despite the tight range, suggests genuine two-sided fighting rather than quiet drifting, and is generally read as a more convincing stall.
Common mistakes with the harami pattern
- Entering immediately on the small candle, before any confirmation, and getting caught if the original trend simply resumes.
- Ignoring the harami cross variant, which often signals more meaningful indecision than a regular harami.
- Trading haramis that form in the middle of a range with no trend behind candle one, where the pattern carries far less meaning.
- Setting the stop too tight, right at the edge of the small candle, rather than beyond the full extreme of candle one.
Seeing the stall, not trusting it
The tricky part of trading a harami is psychological as much as technical. You see momentum stall, you have a real thesis for a reversal, but the pattern by design has not confirmed anything yet. Some traders jump in too early because waiting feels like missing the move. Others wait so long for confirmation that they miss the actual entry once it comes. Reading the pattern correctly is the easy half. Waiting for confirmation without either jumping the gun or freezing past the entry is the harder half, and it is where most of the real difficulty in trading this pattern actually lives.
Frequently asked questions
What is the difference between a harami and an engulfing pattern?
They are opposites in shape. An engulfing candle is large and covers the previous smaller candle. A harami is small and sits inside the previous larger candle. Engulfing shows active reversal within one session. Harami shows the previous move stalling, without yet confirming a reversal.
Is a harami cross stronger than a regular harami?
Many chart readers treat it that way, since a true doji as the second candle shows a more complete standoff between buyers and sellers than a small-bodied candle that still leans slightly in one direction.
Should I trade a harami without waiting for confirmation?
It is not advisable. The harami by itself only shows the previous move has stalled, not that the opposite side has taken control. Waiting for the next candle to confirm reduces the number of false signals you act on.
Does the second candle in a harami need to be a different color?
No. The color of candle two is less important than its body being fully contained inside candle one’s body. A same-color small candle inside a larger opposite candle still counts as a valid harami.
Where does the harami pattern work best?
It works best after an extended trend, at a level that has meaning, like a prior swing high or low, a round number, or a tested support or resistance zone. A harami in the middle of a quiet range says very little.
Where to go from here
The harami teaches a specific lesson that other patterns do not: sometimes the most useful information a chart gives you is that nothing more is happening, not that something new has started. Learning to read stalled momentum, and to wait for it to become confirmed before acting, is a genuinely useful skill. Whether you can sit through that waiting period without either jumping early or missing the entry is the part that actually separates results.
Rukna bhi ek signal hai, sirf move hi signal nahi hota.
Related reading:
- Candlestick Patterns: The Complete Guide for F&O Traders
- Continuation vs Reversal Chart Patterns: The Complete Comparison
- Market Structure: How to Read Higher Highs and Lower Lows
Spotting a stall on the chart is easy. Sitting through the wait for confirmation without jumping early is the real test. I run a free live session twice a week for traders with two or more years of experience who know the setups but still cannot execute under pressure. Register for the next free session here.
I am Samir Dash, founder of Mindful Trading Hub. I work with experienced traders on live market decision-making. More about my story here.