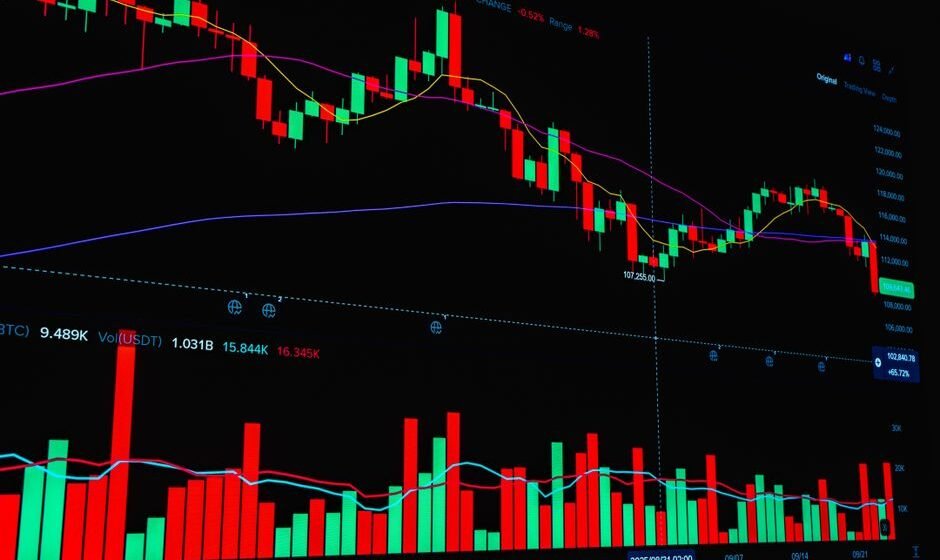

An engulfing pattern needs two candles. The second candle’s body fully covers, or engulfs, the body of the first candle. Not the wicks, the body. This means the second session did not just push back against the first one, it erased it completely by the close.
This is one of five posts in our complete candlestick patterns guide. Here we cover bullish and bearish engulfing patterns, why they form, and how to trade them with a defined plan.
Bullish engulfing: a full reversal within two candles
A bullish engulfing pattern has a red candle followed by a green candle. The green candle opens at or below the red candle’s close, and closes above the red candle’s open. Its body swallows the entire body of the red candle before it.
Picture Nifty at 24,900. Session one is a red candle: opens at 24,900, closes at 24,820. Session two opens at 24,800, below the previous close, and then closes at 24,940, above the previous open. Buyers didn’t just stop the decline, they took back every point sellers had gained and then some, all within one session.
This shows a decisive shift. The sellers who were in control on day one lost control entirely on day two. That kind of full reversal, in a single session, tends to draw attention from other market participants, which is part of why the pattern often gets follow-through.
Bearish engulfing: the mirror image
A bearish engulfing pattern has a green candle followed by a red candle that opens at or above the green candle’s close and closes below the green candle’s open, swallowing its entire body.
Say Bank Nifty is at 51,200. Session one is green: opens at 51,200, closes at 51,400. Session two opens at 51,420, above the previous close, and then sellers take over and close it at 51,150, below the previous open. Buyers who were winning the day before got fully overrun.
Why size and location matter more than the label
Not every engulfing pattern carries equal weight. A bullish engulfing candle where the second candle’s body is only slightly bigger than the first is a weaker signal than one where the second candle’s body is two or three times the size, showing overwhelming force rather than a narrow win.
Location matters just as much as it does for every other pattern in this series. A bullish engulfing candle at a random price in the middle of a range tells you less than one forming exactly at a support zone that has held before, or after an extended decline where sellers are likely getting tired.
Volume as a supporting clue
Where volume data is available, an engulfing pattern on higher than average volume is a stronger version of the signal than the same shape on light volume. Higher volume means more participants agreed with the shift, not just a handful of trades moving price in a thin market. This is a supporting clue, not a requirement, since intraday volume data on index derivatives can be noisy.
How to trade an engulfing pattern with a plan
- Confirm the two-candle structure clearly. The second body must fully cover the first body, not just overlap it.
- Check the context. Is this at a level, after a real trend, or just noise in the middle of a range?
- Consider waiting one more candle. Some traders enter right at the close of the engulfing candle. A more conservative approach waits for the next candle to hold in the new direction before entering, trading a slightly worse price for more confirmation.
- Set your stop at the extreme of the pattern. For a bullish engulfing trade, below the low of the two-candle pattern. For a bearish engulfing trade, above the high.
A concrete example, worked through
Say Nifty has been falling from 25,200 to 24,700 over eight sessions. On session nine, price opens at 24,700 and closes lower at 24,640, a small red candle. On session ten, price opens at 24,600, below the prior close, and rallies to close at 24,790, above session nine’s open of 24,700. This is a bullish engulfing candle sitting at the bottom of an eight-day decline, near a level that held twice in the prior quarter.
A trader following a plan would enter either at the close of session ten, or wait for session eleven to hold above 24,700 before entering. The stop would sit below session ten’s low of 24,600. The risk on the position is now clearly defined before a rupee is committed.
Why knowing this pattern is not the same as trading it well
The engulfing pattern is one of the easier candlestick shapes to spot, because it is visually obvious even at a glance. That is exactly why it causes a specific execution problem. Traders see the shape forming in real time, on the right side of the chart, before the candle has closed. The temptation to enter early, before the pattern is actually confirmed, is strong precisely because the setup looks so clean. Waiting for the candle to actually close, and for the body to actually cover the prior one, takes more discipline than the pattern itself takes skill to identify.
Engulfing patterns compared with other reversal candles
It helps to see how the engulfing pattern relates to the other reversal candles covered in this series. A hammer shows rejection within a single candle, using the wick as evidence. An engulfing pattern shows rejection across two candles, using the full body of the second candle to overwrite the first. Because it uses two complete sessions instead of one wick, an engulfing pattern often reads as a clearer, more deliberate shift, since it required real conviction on the second day, not just a single sharp intraday move.
This does not make engulfing patterns automatically superior. It simply means the two patterns are built from slightly different evidence, and traders often look for one to confirm the other, such as a hammer followed a session or two later by a bullish engulfing candle at the same level, which stacks two independent signals on top of each other.
What an engulfing pattern looks like when it fails
Understanding failure is as useful as understanding the ideal case. A bullish engulfing pattern fails when, despite the clean two-candle shift, price does not follow through and instead drifts back down through the pattern’s low within the next few sessions. This happens more often when the pattern forms without a real trend behind it, or at a price with no meaningful support nearby. This is exactly why the stop below the pattern’s low matters. It caps the cost of a failure that will happen a meaningful percentage of the time, no matter how clean the shape looked.
Frequently asked questions
Does the wick matter in an engulfing pattern?
The core definition is about the body, not the wick. Some traders also want the second candle’s full range, including wicks, to cover the first candle’s range, which is a stricter version of the pattern. Either definition is fine as long as you apply it consistently.
What is the difference between an engulfing pattern and a piercing line?
An engulfing candle’s body fully covers the prior candle’s body. A piercing line only closes above the midpoint of the prior candle’s body, a partial recovery rather than a complete one. Engulfing patterns generally show a stronger shift.
Can an engulfing pattern form in a sideways, range-bound market?
Yes, but it tends to mean less there, since there is no clear trend or exhausted side for the reversal to be reversing. Engulfing patterns are most informative after a real, sustained move in one direction.
How reliable is the engulfing pattern compared to other candlestick patterns?
No candlestick pattern has a fixed, trustworthy reliability number, and engulfing patterns are no exception. What makes this pattern useful is the clarity of the shift it shows within two candles. Reliability still depends heavily on location, trend context, and confirmation.
Should I enter as soon as the engulfing candle closes, or wait for the next candle?
Both approaches are used by real traders. Entering at the close gets you a better price but less confirmation. Waiting one more candle gets you more confirmation at a slightly worse price. Pick one approach and apply it consistently, rather than switching based on how confident you feel in the moment.
The real takeaway
An engulfing candle is one of the clearest pictures a chart can give you of control changing hands. It is easy to see and easy to explain after the fact. The actual work is in waiting for it to finish forming, checking it sits somewhere meaningful, and then entering with a stop already decided, instead of getting swept up in how obvious the shape looks on the screen.
The clarity of this pattern is exactly why it rewards patience. A shape this easy to see is also easy to react to too quickly, and the traders who benefit most from it are usually the ones who let the candle finish before they act on it.
Do candle ka fight dikh raha hai, ab faisla tumhara hai.
Related reading:
- Chart Patterns Every Trader Should Know
- Advanced Candlestick Patterns: Multi-Candle Formations Explained
- Price Action Trading: A Practical Guide
Want the complete course? This fits into Samir Dash’s free Candlestick Patterns course on this site, a full step by step guide from the basics onward.
Recognising the engulfing candle is the easy part. Not jumping in before it actually closes is where most traders lose the edge. I run a free live session twice a week for traders with two or more years of experience who know the setups but still cannot execute under pressure. Register for the next free session here.
I am Samir Dash, founder of Mindful Trading Hub. I work with experienced traders on live market decision-making. More about my story here.