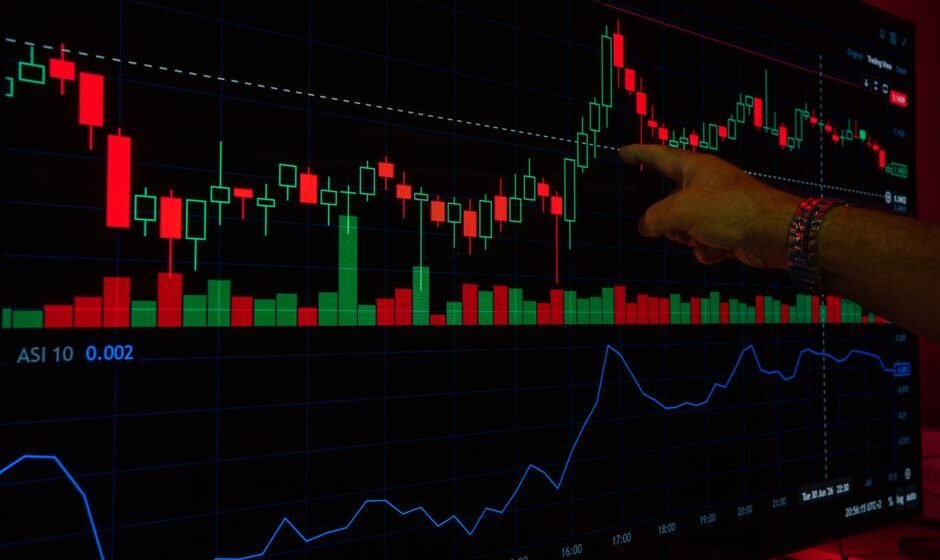

Adding more indicators to your chart usually does not add more information. It adds more copies of the same information, dressed up as something new, plus a fresh source of conflicting signals to argue with yourself over.
This sounds obvious once stated plainly, and yet it is one of the most common patterns in retail trading. A trader who is not winning consistently tends to add an indicator, rather than get better at reading the ones already on the chart. This post explains why that instinct backfires and what to do instead.
Why most indicators are measuring the same thing twice
Nearly every popular technical indicator is built from one of three raw ingredients: price, moving averages of price, or volume. MACD is built from two EMAs. RSI is built from the size of recent up and down closes. Bollinger Bands are built from a moving average plus standard deviation. Stochastic is built from where the current close sits within a recent price range.
These all sound different because the math looks different and the lines are drawn differently. But they are frequently responding to the same underlying price action at the same time. When Nifty has a strong momentum move, RSI rises, MACD’s histogram grows, and price pushes toward the upper Bollinger Band, all at once, because all three are reading variations of the same thing: strong recent upward price movement.
This means a chart with RSI, MACD, and Stochastic all loaded on at once is not giving you three independent opinions. It is showing you the same underlying momentum from three different angles, dressed up as three separate confirmations. That can feel like strong confluence. Often it is closer to counting the same vote three times.
Where real conflict comes from
Genuine disagreement between indicators usually happens for a specific, identifiable reason, not because one indicator is right and another wrong. Different lookback periods respond at different speeds. A 9-period RSI will flag overbought before a 21-period RSI does, on the exact same price data. A short EMA crossover can turn bullish while a longer moving average trend filter still reads bearish, simply because they are measuring different time horizons of the same price series.
Piling on more indicators without understanding this multiplies the number of these timing mismatches, without adding real new information. Each new tool is another opportunity for a minor timing disagreement to look like a meaningful contradiction, and another excuse to hesitate on a trade that was actually fine.
The real cost: decision paralysis
The practical damage from indicator overload rarely shows up as a bad trade taken. It shows up as a good trade not taken, because five things had to agree and only four did.
A trader looking at eight indicators before every entry is not making a more informed decision than a trader looking at two. They are giving themselves eight separate chances for one of those readings to disagree just enough to talk themselves out of a setup that was actually valid. More inputs do not automatically produce a clearer decision. Past a certain point, they produce more noise for your own doubt to hide inside.
This is often mistaken for caution. It is not caution. Caution is a defined risk rule decided in advance. This is decision avoidance wearing the costume of thoroughness, and it usually gets worse, not better, the more experienced and knowledgeable a trader becomes, because an experienced trader can generate a plausible-sounding reason to hesitate on almost any chart.
What a lean chart actually looks like
A workable chart setup rarely needs more than three tools, and each one should be answering a genuinely different question.
- One tool for trend direction. A moving average or two, answering “which way is the broader move going.”
- One tool for momentum or timing. RSI or MACD, not both, answering “is this move gaining or losing steam right now.”
- Price action itself. Support, resistance, candle structure, and volume, answering “what is actually happening at this exact level.”
Three tools answering three different questions gives you more real information than eight tools mostly answering the same one. This is not about trading with less analysis. It is about trading with less repetition dressed up as analysis.
A worked example: one setup, three verdicts
Say Nifty is trading at 24,850 and pulls back to a rising 20-EMA that has held twice already this week. Price action alone says this is a clean, tested trend continuation entry.
Now load the chart up. A 9-period RSI on the 5-minute timeframe reads 42 and is drifting down, which looks like weakening momentum. A 21-period RSI on the same chart reads 58 and is flat, which looks neutral. MACD on the 15-minute chart just had its signal line cross below the MACD line, which looks bearish. Stochastic on the 5-minute chart is oversold at 18, which looks like a buy.
Four indicators, four different stories, all pulled from the same 20 minutes of price movement. None of them are wrong. They are measuring the same underlying move at different speeds and on different timeframes, which is exactly what produces this kind of scatter. A trader staring at all four at once has no clean answer, not because the setup is genuinely unclear, but because the chart is asking four slightly different questions and expecting one tidy response.
The trader using two tools, a trend filter and price action at the level, sees the same 20 minutes very differently: price held a proven level in an established uptrend. That is a complete answer. The other four readings were never additional information about whether to take the trade. They were four separate opportunities to talk yourself out of a valid one.
How to audit your own chart
A useful exercise is to remove every indicator from your chart, one at a time, and ask what specific question it is answering that the others are not. If two indicators consistently move together and give the same read at the same time, one of them is not adding information, it is adding screen clutter and a second opportunity to second-guess yourself.
Do this honestly rather than defensively. Most traders discover that half their indicator stack is redundant once they actually check what each one is doing across a handful of real trades from their own journal.
Why this connects directly to execution
Every extra indicator on the chart is, quietly, an extra veto power over your own plan. The setup you have used successfully for months meets its price and trend conditions, and then the fourth or fifth indicator on your chart flashes something slightly off, and you skip the trade. Three days later the trade works exactly as it usually does, without you in it.
This is not usually a technical analysis problem. The chart gave you a valid setup. The problem is that the extra tools gave your hesitation a place to hide, a “logical” reason not to pull the trigger that felt like discipline in the moment but was actually avoidance. Simplifying the chart does not just clean up your screen. It removes some of the places where indecision can disguise itself as analysis.
Frequently asked questions
How many indicators should I actually use?
Most experienced traders settle on two to four, each answering a distinct question such as trend, momentum, and volatility, plus plain price action. There is no universal correct number, but if you cannot state clearly what unique question each indicator answers, you likely have too many.
Is it wrong to use RSI and MACD together?
Not necessarily, but recognise they often move together since both measure momentum from related underlying math. Using both for extra “confirmation” gives less independent information than traders assume. Using one alongside a genuinely different tool, like a moving average for trend, adds more.
Why do I feel more confident with more indicators, even if it hurts my results?
Confidence from stacking indicators is often confidence in the appearance of thoroughness, not confidence backed by independent information. It can feel safer while actually making entries less consistent, because more tools means more chances for a minor disagreement to stall the decision.
Should beginners use fewer indicators than experienced traders?
The direction of the mistake is often the opposite of what people expect. Experienced traders, who understand more indicators, are often the ones who stack the most, because each one seems individually justified. The discipline to stay lean tends to matter more with experience, not less.
What should I do instead of adding a new indicator when a trade doesn’t work?
Review the trade against your existing rules first. Most losing trades trace back to a rule that was skipped or a size that was too large, not to a missing indicator. Adding a new tool without that review usually just adds a new place to make the same underlying mistake.
The real point
A cluttered chart feels thorough and often functions as a slow way to talk yourself out of trades your own rules already approved. The fix is rarely a smarter indicator. It is fewer of them, each doing a distinct job, so your hesitation has fewer places left to hide.
Simplicity is not the beginner’s approach here. It is usually the harder discipline to hold onto once you know enough indicators to justify adding one more.
Kam tools, zyada clarity.
Related reading:
- VWAP: The Indicator Institutions Actually Use
- Market Structure: How to Read Higher Highs and Lower Lows
- Price Action Trading: A Practical Guide
- Combining Multiple Indicators Without Overload
A cluttered chart gives your hesitation more places to hide behind. Clearing it out does not fix the real problem if the real problem is what happens when a clean signal still does not get you to click the button. I run a free live session twice a week for traders with two or more years of experience who know the setups but still cannot execute under pressure. Register for the next free session here.
I am Samir Dash, founder of Mindful Trading Hub. I work with experienced traders on live market decision-making. More about my story here.