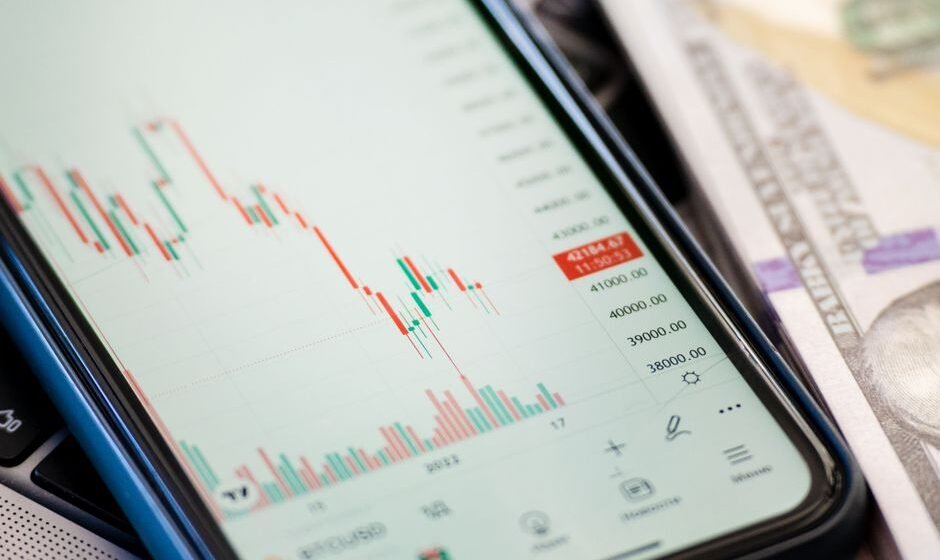

A moving average is the average closing price of an instrument over a fixed number of past candles, recalculated fresh on every new candle.
That is the whole definition. A 20-period moving average on a daily Nifty chart is the average of the last 20 daily closes. Tomorrow it drops the oldest close and adds today’s. The line moves because the average moves. Nothing more mysterious is happening under the hood, and understanding that plainly stops you from treating it like a magic support line.
This is the pillar post on moving averages. It covers what they are actually calculating, the difference between the common types, how traders use them in real Nifty and Bank Nifty trading, and where they quietly fail.
Why an average of price tells you anything useful
Price on its own is noisy. One candle can spike on a single large order and mean very little. An average smooths that noise out, because one unusual candle only shifts a 20-day average by a small fraction.
What is left after the noise is removed is the general direction price has been moving in. That is the entire job of a moving average: to show you the underlying trend without the day to day wobble. It does not predict where price is going. It reports where price has been, in a smoothed form.
This is also its biggest weakness. Because it is built from past prices, it always reacts after the fact. A moving average is a lagging indicator, not a leading one. If Nifty turns down sharply, the moving average will still be pointing up for a few days, because it is carrying the weight of the earlier up-move in its calculation.
Simple moving average vs exponential moving average
There are two versions you will see everywhere.
- Simple moving average (SMA): every price in the lookback period is weighted equally. The close from 20 days ago counts exactly as much as yesterday’s close.
- Exponential moving average (EMA): recent prices are weighted more heavily than older ones. Yesterday’s close matters more than the close from three weeks ago.
The practical difference is speed. An EMA turns faster when price changes direction, because recent candles carry more weight. An SMA turns slower and smoother, because it treats old and new data the same. Neither is “better” in an absolute sense. A faster line gives you earlier signals and more false ones. A slower line gives you fewer signals and later ones. You are choosing between speed and reliability, not picking the correct answer.
The periods traders actually watch
A few lookback periods show up so often that they function as informal levels the whole market watches, which becomes partly self-fulfilling.
- 20-period: a short-term trend read, commonly used on daily charts for swing trades.
- 50-period: a medium-term trend read, often used to judge whether a stock or index is in a broader uptrend or downtrend.
- 200-period: the long-term trend line most widely watched on Nifty and individual stocks. Price sustained above the 200-day is generally read as a long-term uptrend.
On intraday charts, traders commonly use shorter periods like the 9-EMA or 21-EMA on a 5-minute or 15-minute chart, for the same reason at a faster timescale.
How the line is actually used
As dynamic support and resistance
In a clean uptrend, price often pulls back toward the rising moving average and bounces from there rather than breaking it. Traders use this to time entries into an existing trend, buying near the average rather than chasing price higher. This works because enough market participants are watching the same line and placing similar orders around it, not because the line has any independent power over price.
As a trend filter
Many traders use a moving average as a simple filter before they even look for a setup. If Nifty is trading above its 50-day moving average, they only look for long trades. Below it, they only look for shorts. This does not generate entries by itself. It narrows the field so you are not fighting the broader trend.
Crossovers
A crossover is when a faster moving average crosses above or below a slower one, for example the 9-EMA crossing above the 21-EMA. Traders read this as an early signal that momentum is shifting. The catch is that crossovers happen constantly in sideways, choppy markets, generating one false signal after another. A crossover strategy works best when it is combined with some check for whether the market is actually trending, not chopping.
Where moving averages fail
In a sideways market, price crosses back and forth over a moving average repeatedly, with no real trend to follow. Every crossover looks like a signal and almost none of them pay off. This is the single most common way traders lose money with moving averages: applying a trend tool to a market that has no trend.
The lag problem also means moving averages will always get you in late and out late relative to the actual turn. This is a structural feature, not a flaw you can fix with a different period. Traders who expect a moving average crossover to catch the exact top or bottom are asking the tool to do something it cannot do.
There is also a psychological trap worth naming directly. A moving average gives you a clean, confident-looking line on the chart, and confidence in the tool does not translate into confidence in pulling the trigger. It is common to watch price hold perfectly above the 20-EMA, see the setup you have used a hundred times, and still hesitate because the last two trades on this same setup lost money. The indicator was reading the chart correctly. The gap was in acting on it. Knowing what the tool is telling you and being willing to act on that information under real pressure are two separate skills, and the second one is usually the one that is actually missing.
A worked example on Nifty
Say Nifty is trading at 24,800 and has been climbing steadily for three weeks. The 20-day EMA is at 24,550, the 50-day is at 24,100, and the 200-day is at 23,200. All three are stacked in order, price above the 20-EMA, the 20-EMA above the 50-day, the 50-day above the 200-day. This is a clean uptrend by the definition used earlier in this post.
Now Nifty pulls back over three sessions, from 24,800 down to 24,560, right into the 20-EMA. Price holds there for a day, prints a small green candle, and starts moving up again. A trader using the moving average as dynamic support would treat this as a valid entry, buying near 24,560 with a stop just below the 20-EMA, say at 24,450, because a clean break below the average would suggest the pullback has turned into something bigger than a pause.
Now compare that to a different week. Nifty has been chopping between 24,300 and 24,700 for two weeks with no clear direction. The 20-EMA is roughly flat at 24,500, and price is crossing above and below it almost every second day. A trader applying the same “buy the pullback to the 20-EMA” rule here would get in and out repeatedly, most of it losing money, because there is no trend for the average to support. Same tool, same rule, completely different outcome, because the market condition underneath it was different. This is the exact distinction covered above between a trending market and a ranging one, and it is worth actually checking before you take the trade, not after it fails.
A simple way to combine periods
A common, workable approach is to use three moving averages together instead of one: a short one like the 20-period for immediate direction, a medium one like the 50-period for the intermediate trend, and a long one like the 200-period for the big picture. When all three are stacked in the same order, short above medium above long in an uptrend, you have a market that is trending cleanly across multiple timeframes. When they are tangled together, that is your signal the market is in a range and trend-following tools will likely whipsaw you.
Frequently asked questions
Which moving average period is best for intraday trading?
There is no single best period, and anyone claiming a fixed number works for every stock is oversimplifying. Shorter periods like 9 or 21 on a 5-minute chart react faster and suit faster intraday trades. Longer periods like 50 suit swing positions held over days. Match the period to how long you actually intend to hold the trade.
Should I use SMA or EMA?
Neither is universally correct. EMA reacts faster to recent price, which suits traders who want earlier signals and can tolerate more false ones. SMA is smoother and generates fewer, later signals. Many traders use EMA for entries and SMA for a broader trend read.
Is the 200-day moving average actually important?
It is widely watched, which gives it some self-fulfilling weight, since many participants react around it. But it is still a lagging, backward-looking line. Treat it as one input describing the long-term trend, not as a level with predictive power on its own.
Why does price keep crossing my moving average without a real move happening?
This usually means the market is range-bound rather than trending. Moving averages are trend tools. In a range, apply a different approach, such as watching support and resistance levels, rather than treating every crossover as a trade signal.
Can moving averages be used alone, without other indicators?
Yes, and many experienced traders prefer this. Moving averages combined with plain price action, support and resistance, and volume, give a clean read without the confusion of stacking too many overlapping tools on one chart.
The real point
A moving average is not a prediction. It is a smoothed record of where price has already been, and it is genuinely useful for reading trend direction once you stop expecting it to call tops and bottoms.
The line will tell you the truth about the trend. Whether you act on that truth, on the third trade after two losses, is a separate question entirely.
Chart sahi padhna ek baat hai, uspar act karna doosri.
Related reading:
- VWAP: The Indicator Institutions Actually Use
- Market Structure: How to Read Higher Highs and Lower Lows
- Price Action Trading: A Practical Guide
Want the complete course? This fits into Samir Dash’s free Price Action Trading course on this site, a full step by step guide from the basics onward.
Knowing the trend from a moving average is one thing. Trading it when the last two setups lost money is another. I run a free live session twice a week for traders with two or more years of experience who know the setups but still cannot execute under pressure. Register for the next free session here.
I am Samir Dash, founder of Mindful Trading Hub. I work with experienced traders on live market decision-making. More about my story here.