

Candlestick Patterns
This is a complete, dedicated course on candlestick patterns. If the Trading Foundation course taught you the alphabet, this course teaches you entire words, 36 of the most useful candlestick patterns a trader can recognize, organized clearly by how many candles each one uses.
This is a full course, not a short article, so it does not rush and it does not skip patterns. We use picture sheets for almost every pattern, so you can actually see the shape, not just read a description of it. Bookmark this page. Come back to it any time you spot an unfamiliar shape on a real chart.
A free course by Samir Dash, founder of Mindful Trading Hub.
What You Will Learn
- Step 1: A Quick Refresher, What a Candle Shows
- Step 2: Why Candlestick Patterns Work, the Psychology Behind Them
- Step 3: Single Candle Patterns, Part 1, the Doji Family and Early Reversal Signals
- Step 4: Single Candle Patterns, Part 2, More Shapes Worth Knowing
- Step 5: Two Candle Patterns, Part 1, Engulfing, Piercing, and Tweezers
- Step 6: Two Candle Patterns, Part 2, Harami, Belt Hold, and Kickers
- Step 7: Three Candle Patterns, Part 1, Stars, Soldiers, and Crows
- Step 8: Multi Candle Patterns, Continuation and Confirmation
- Step 9: How Reliable Are Candlestick Patterns, Really
- Step 10: Context Is Everything, Combining Patterns With Trend and Levels
- Step 11: Using Volume to Confirm a Candlestick Pattern
- Step 12: Reading Candlestick Patterns Across Multiple Timeframes
- Step 13: Common Mistakes When Reading Candlesticks
- Step 14: A Simple Checklist Before Trading a Candlestick Pattern
- Step 15: Quick Glossary, Every Pattern in One Place
- Step 16: What to Do Next
- Frequently Asked Questions
Step 1: A Quick Refresher, What a Candle Shows
Every candle on a chart shows four numbers for one fixed period of time: the open, the high, the low, and the close. The thick part, called the body, shows the gap between the open and the close. The thin lines above and below, called wicks, show the highest and lowest price touched during that time.
If the close is above the open, the candle is bullish, shown in green in this course. If the close is below the open, the candle is bearish, shown in red. If you want a fully illustrated, step by step walkthrough of this idea with a labeled diagram, the Trading Foundation and Price Action Trading courses on this site both cover it in detail. Here, we move straight into the patterns themselves.
Step 2: Why Candlestick Patterns Work, the Psychology Behind Them
A candlestick pattern is not magic. It is simply a picture of a real fight between buyers and sellers, frozen in time. Every pattern in this course tells a small, specific story about who won that fight, how decisively, and how quickly the story changed.
A long green body means buyers pushed price up and held that gain all the way to the close, confident control. A long wick with a small body means one side pushed hard in one direction, but was firmly pushed back before the close, a real rejection of that price area. A tiny body means the two sides fought to a near standstill, real indecision. Once you start reading every candle this way, as a small story about a real fight, patterns stop feeling like memorized shapes and start feeling like something you can reason about.
Step 3: Single Candle Patterns, Part 1, the Doji Family and Early Reversal Signals
These six patterns are built from just one single candle, making them the fastest patterns to spot on any chart.
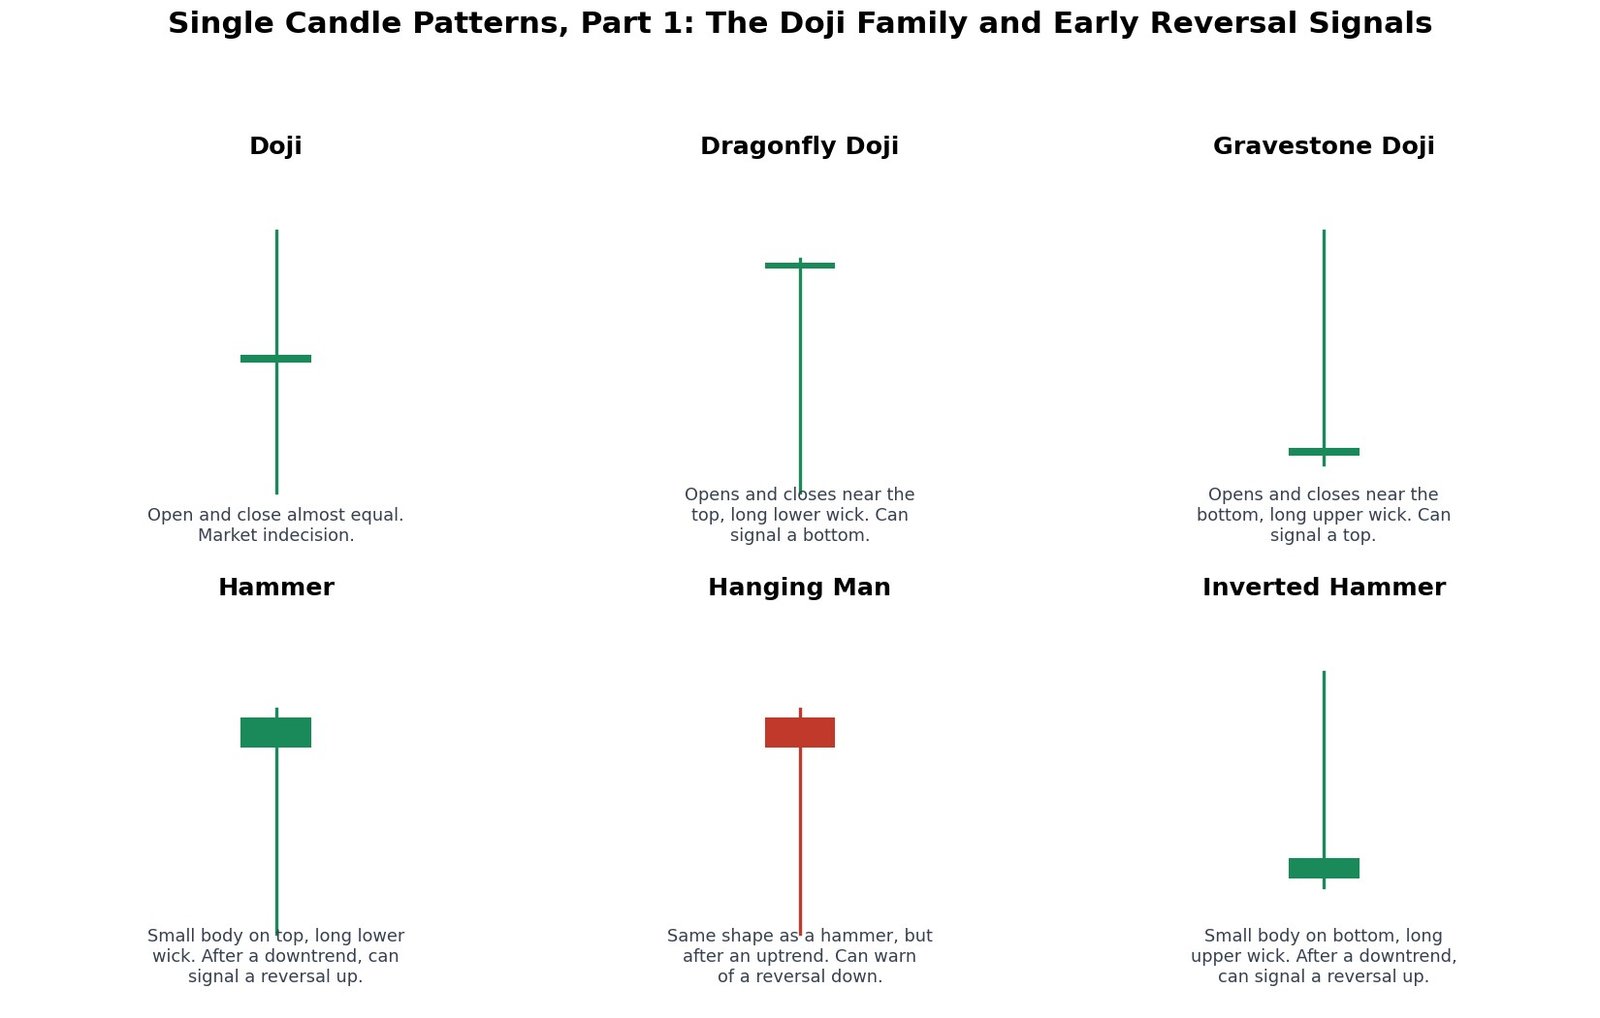
- Doji: Open and close almost equal. Pure indecision between buyers and sellers.
- Dragonfly Doji: Opens and closes near the top, with a long lower wick. Sellers pushed hard but buyers fully reclaimed the move, often near a bottom.
- Gravestone Doji: Opens and closes near the bottom, with a long upper wick. Buyers pushed hard but sellers fully reclaimed the move, often near a top.
- Hammer: A small body near the top, with a long lower wick, appearing after a downtrend. A rejection of lower prices that can signal a reversal up.
- Hanging Man: The exact same shape as a hammer, but appearing after an uptrend instead. A warning sign, not a confirmed reversal.
- Inverted Hammer: A small body near the bottom, with a long upper wick, appearing after a downtrend. Buyers tested higher prices and, while they did not hold the full gain, the attempt itself can signal a coming reversal up.
Step 4: Single Candle Patterns, Part 2, More Shapes Worth Knowing
Six more single candle shapes round out the full picture, from the shooting star’s rejection at the top to the marubozu’s total, one sided control.
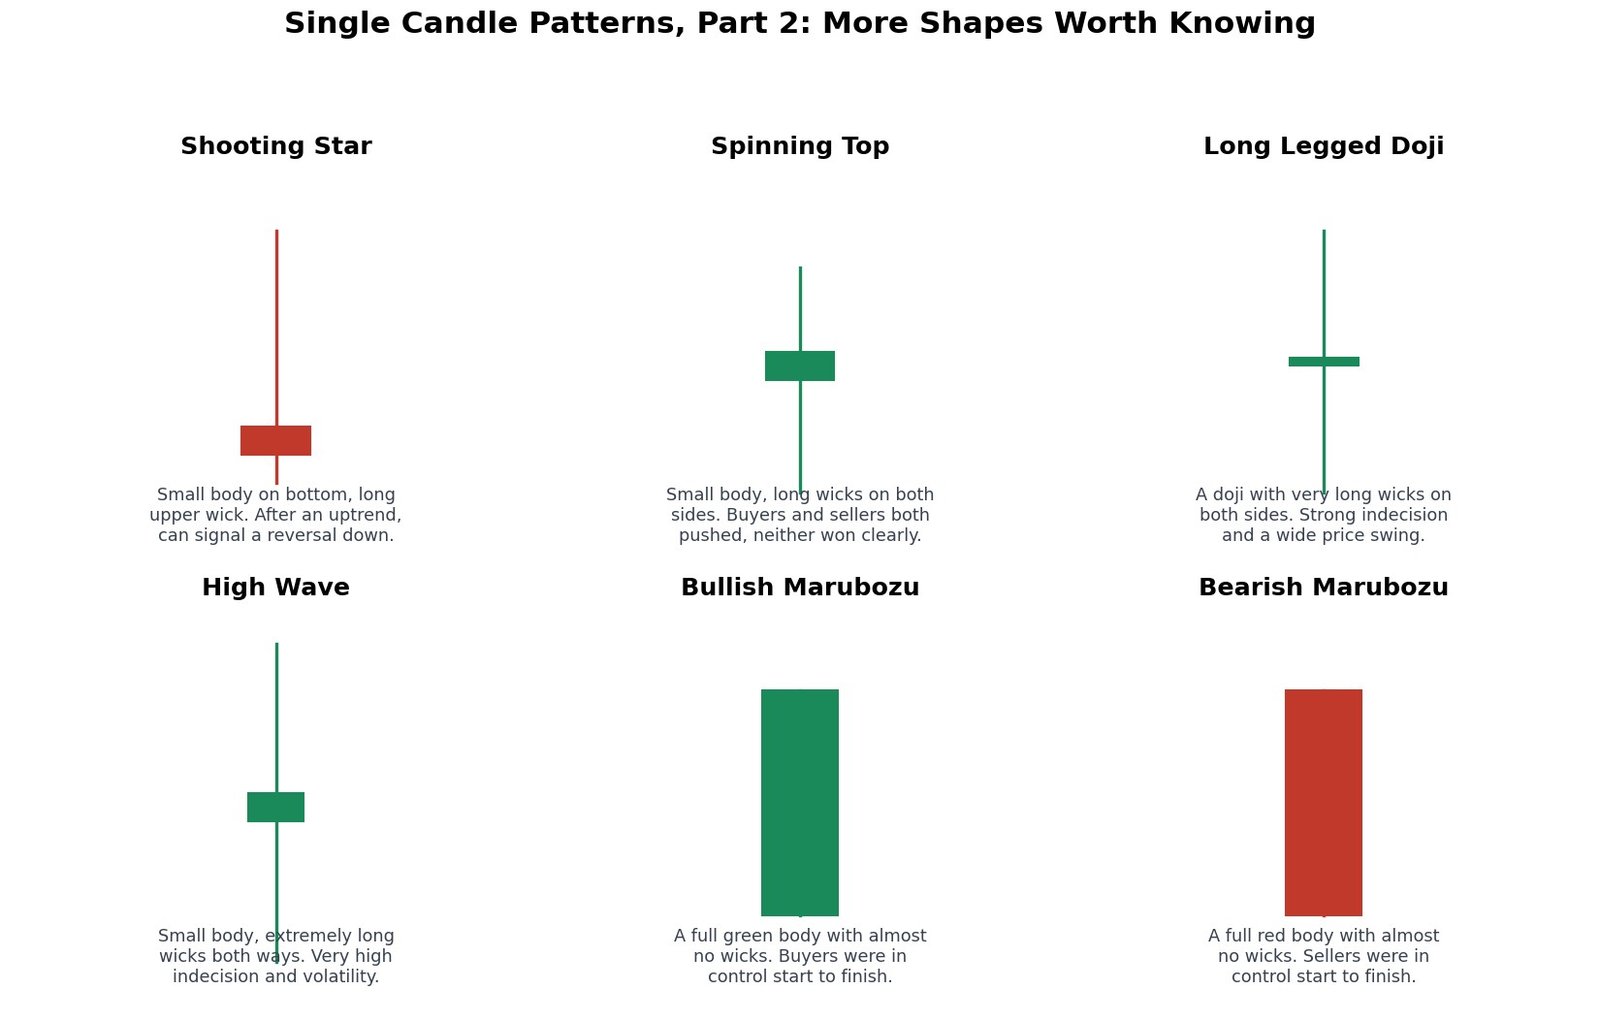
- Shooting Star: A small body near the bottom, with a long upper wick, appearing after an uptrend. The mirror image of a hammer, it can signal a reversal down.
- Spinning Top: A small body with long wicks on both sides. Both buyers and sellers pushed, and neither clearly won.
- Long Legged Doji: A doji with very long wicks on both sides, showing a wide price swing and strong indecision, more extreme than a plain doji.
- High Wave: A small body with extremely long wicks both ways, the most extreme version of indecision and volatility on this list.
- Bullish Marubozu: A full green body with almost no wicks at all. Buyers were in complete control from open to close.
- Bearish Marubozu: A full red body with almost no wicks at all. Sellers were in complete control from open to close.
Step 5: Two Candle Patterns, Part 1, Engulfing, Piercing, and Tweezers
Once you combine two candles, you can start reading a short back and forth story, not just a single moment.
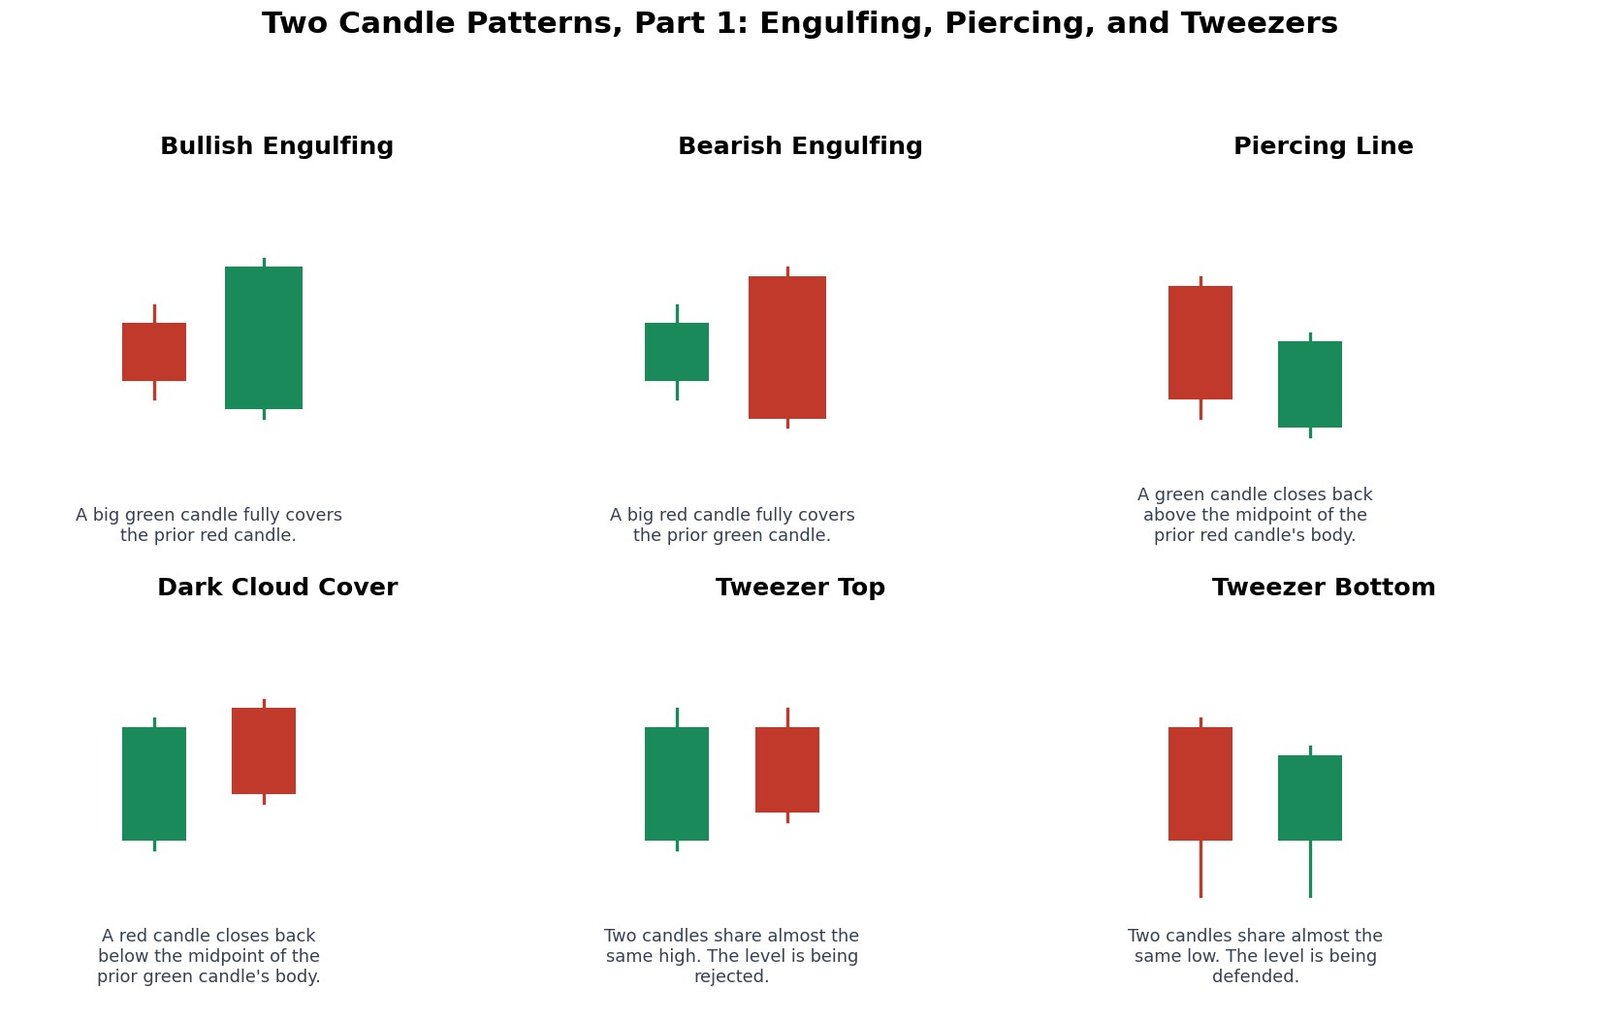
- Bullish Engulfing: A big green candle fully covers the body of the prior red candle. Buyers have firmly taken over.
- Bearish Engulfing: A big red candle fully covers the body of the prior green candle. Sellers have firmly taken over.
- Piercing Line: A green candle closes back above the midpoint of the prior red candle’s body, a meaningful but not complete takeover.
- Dark Cloud Cover: A red candle closes back below the midpoint of the prior green candle’s body, the bearish mirror of a piercing line.
- Tweezer Top: Two candles share almost the exact same high. That price level is being firmly rejected twice in a row.
- Tweezer Bottom: Two candles share almost the exact same low. That price level is being firmly defended twice in a row.
Step 6: Two Candle Patterns, Part 2, Harami, Belt Hold, and Kickers
Six more two candle patterns, including the harami family, where a big candle is followed by a much smaller, contained one, and the kicker, one of the most abrupt patterns on any chart.
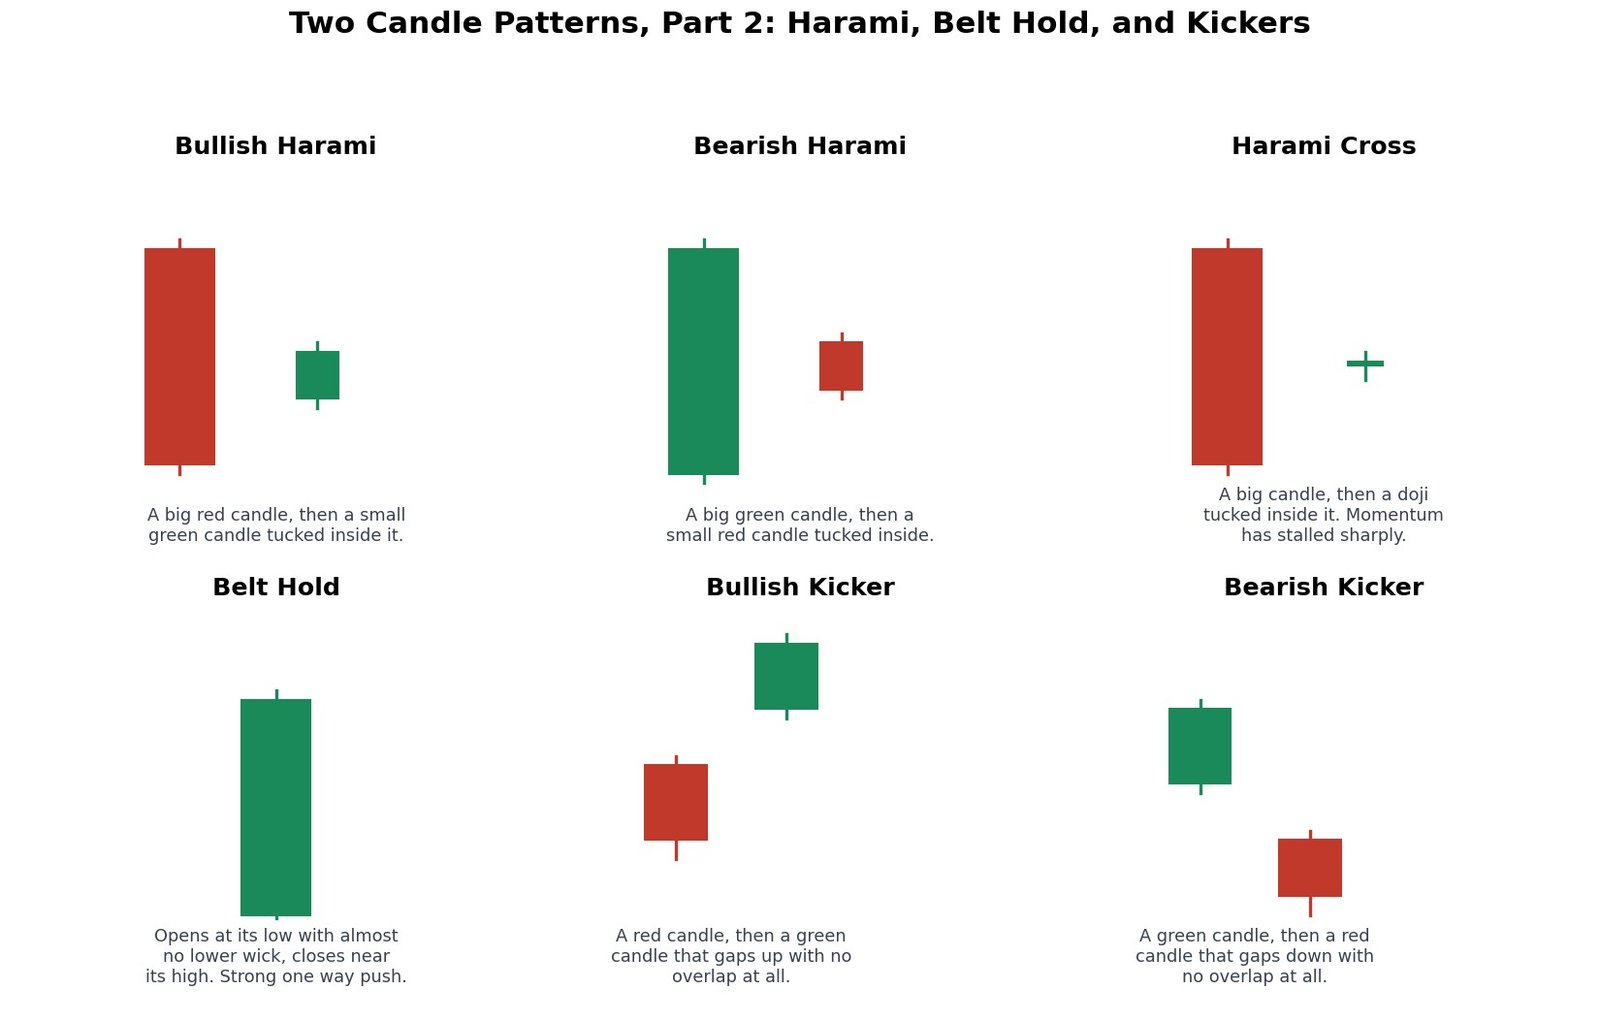
- Bullish Harami: A big red candle, then a small green candle tucked completely inside its body. Momentum is fading and may reverse.
- Bearish Harami: A big green candle, then a small red candle tucked completely inside its body. Momentum is fading and may reverse.
- Harami Cross: A big candle, then a doji tucked inside it, an even stronger stall than a regular harami, since the second candle shows total indecision.
- Belt Hold: A single candle that opens at its low (bullish version) with almost no lower wick, and closes near its high, showing a strong, one directional push from the very first tick. A bearish belt hold is the mirror image, opening at its high and closing near its low.
- Bullish Kicker: A red candle, then a green candle that gaps up with absolutely no overlap between the two bodies. A sudden, forceful change of sentiment, often tied to unexpected news.
- Bearish Kicker: A green candle, then a red candle that gaps down with no overlap at all, the bearish mirror image.
Step 7: Three Candle Patterns, Part 1, Stars, Soldiers, and Crows
Three candle patterns tell a fuller story: a setup, a pause, and a resolution.
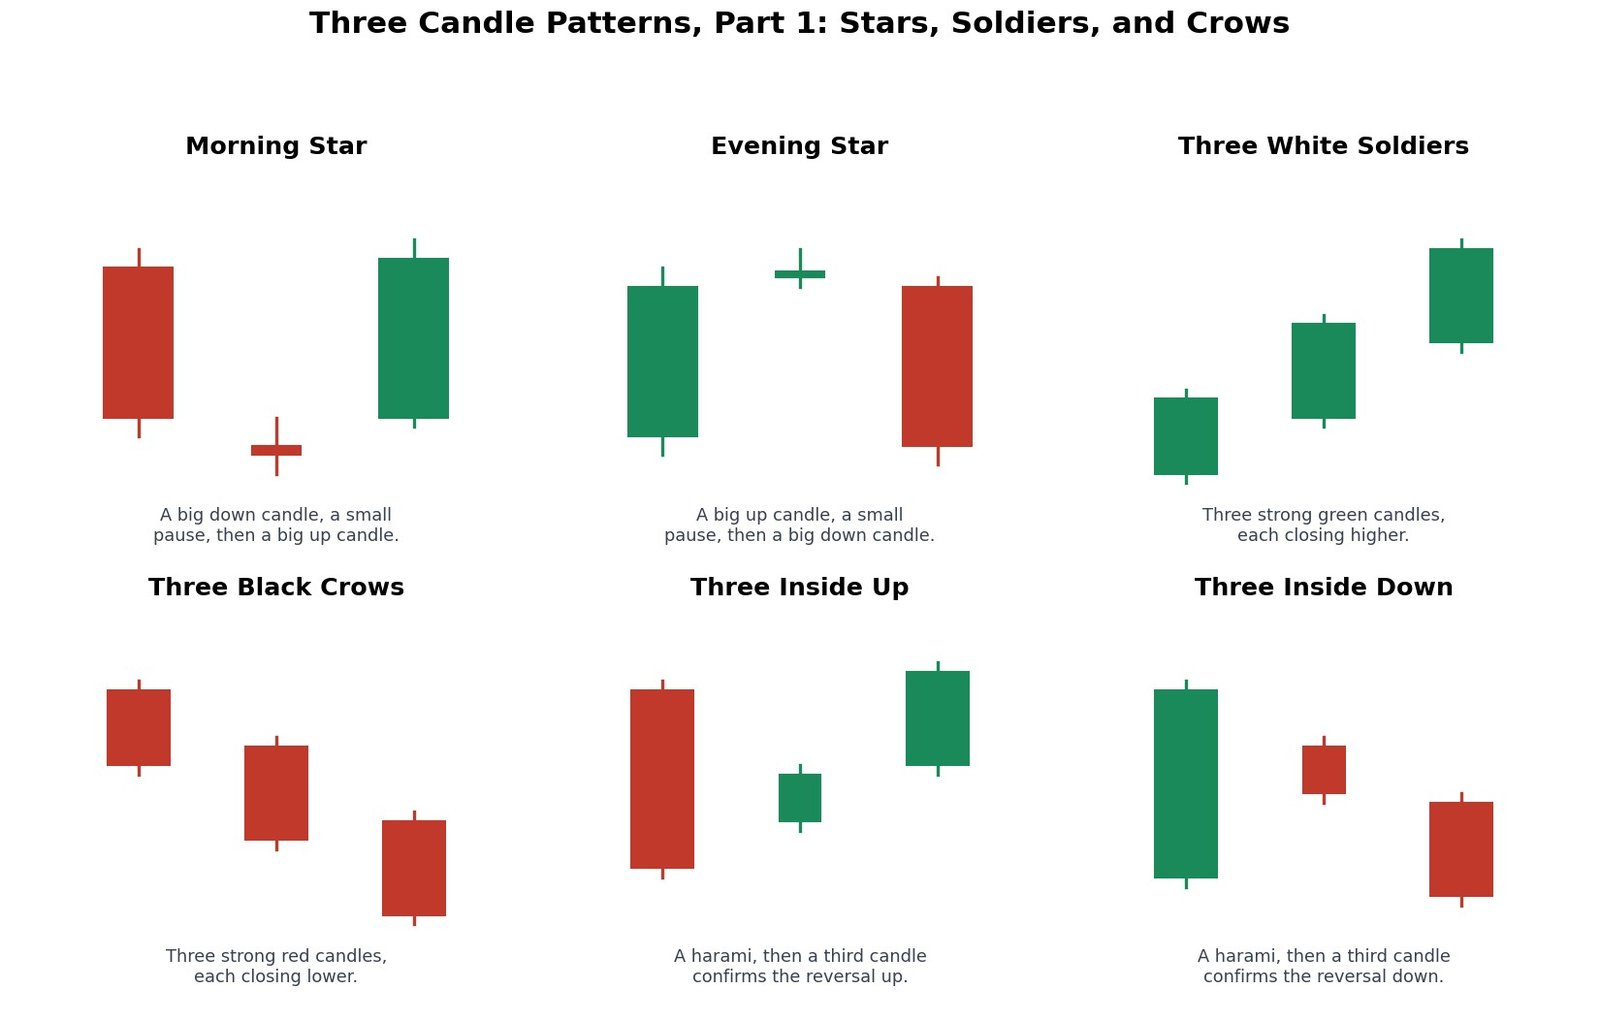
- Morning Star: A big down candle, a small pause candle, then a big up candle. A classic three candle bottoming pattern.
- Evening Star: A big up candle, a small pause candle, then a big down candle. The bearish mirror of a morning star.
- Three White Soldiers: Three strong green candles in a row, each closing higher than the last. Steady, confident, sustained buying.
- Three Black Crows: Three strong red candles in a row, each closing lower than the last. Steady, confident, sustained selling.
- Three Inside Up: A bullish harami (from Step 6), followed by a third candle that closes above the first candle’s open, confirming the reversal up.
- Three Inside Down: A bearish harami, followed by a third candle that closes below the first candle’s open, confirming the reversal down.
Step 8: Multi Candle Patterns, Continuation and Confirmation
This final sheet covers patterns that either confirm an earlier two candle pattern with a third candle, or show a trend pausing briefly before continuing in the same direction.
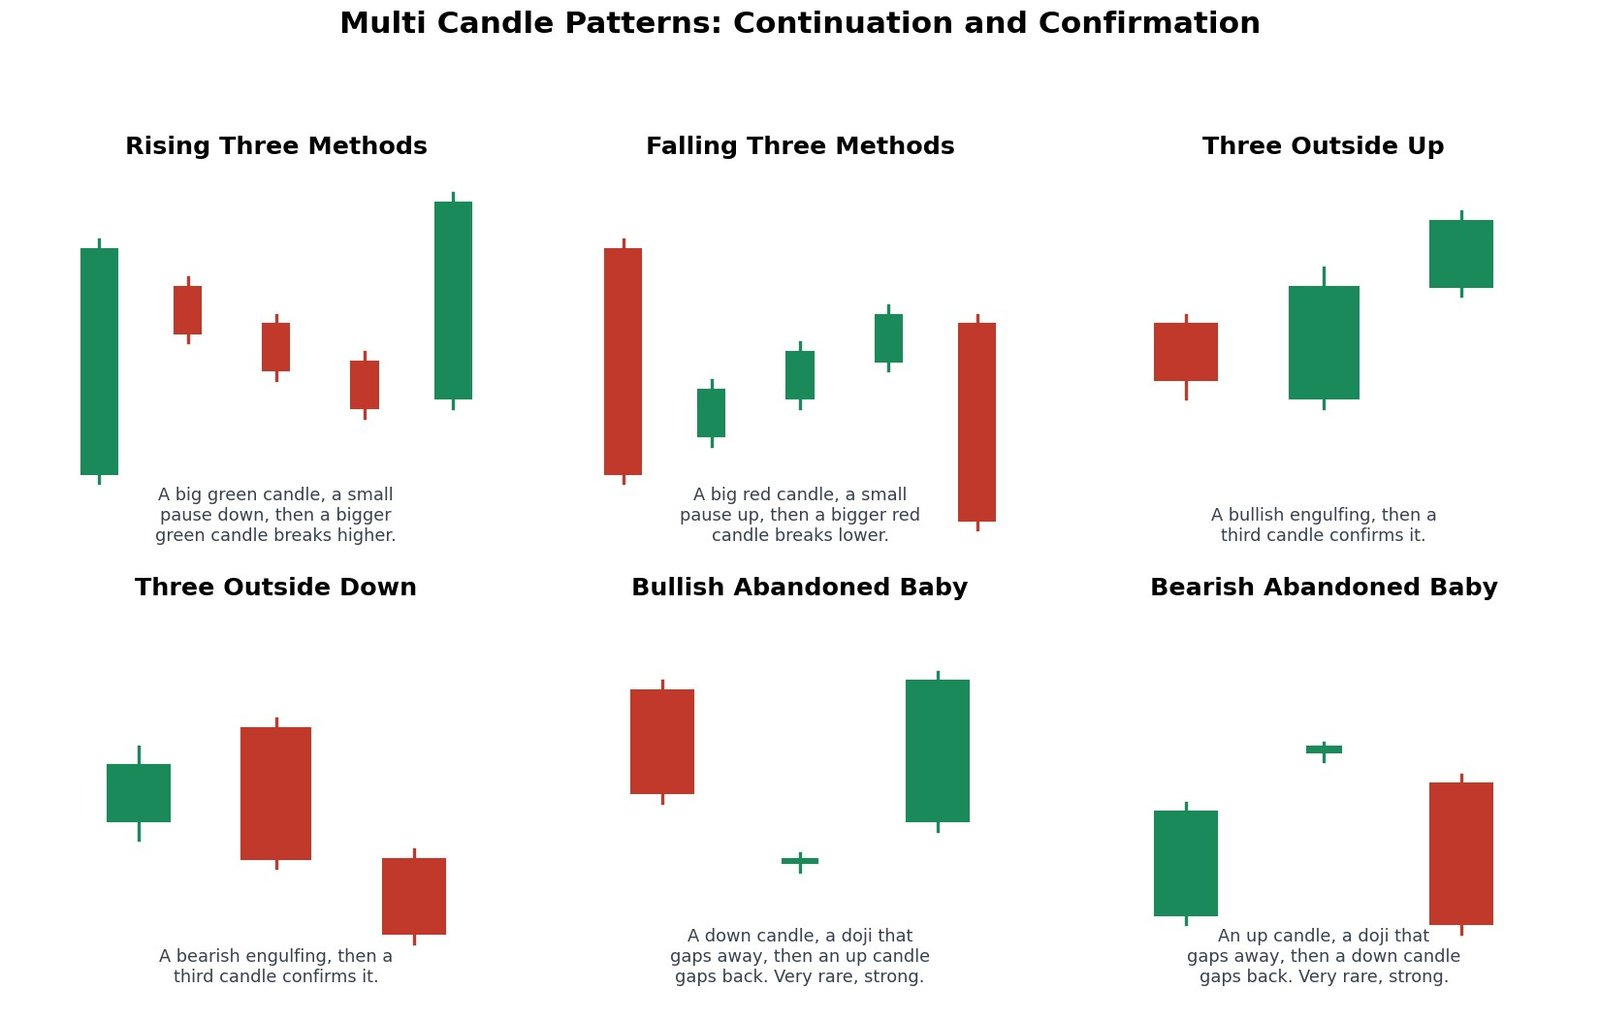
- Rising Three Methods: A big green candle, a short pause of small red candles that stay within its range, then a bigger green candle that breaks to a new high. A continuation pattern inside an uptrend.
- Falling Three Methods: The bearish mirror, a big red candle, a short pause of small green candles, then a bigger red candle breaking to a new low.
- Three Outside Up: A bullish engulfing pattern, followed by a third candle that confirms the move by closing even higher.
- Three Outside Down: A bearish engulfing pattern, followed by a third candle that confirms the move by closing even lower.
- Bullish Abandoned Baby: A down candle, then a doji that gaps completely away from it, then an up candle that gaps back the other way. A rare but very strong reversal signal, since the doji is left isolated on the chart.
- Bearish Abandoned Baby: The bearish mirror, an up candle, an isolated doji gapping away, then a down candle gapping back.
Step 9: How Reliable Are Candlestick Patterns, Really
This is an honest, important question, and the honest answer is: no single candlestick pattern, by itself, reliably predicts the future on its own. Patterns describe what buyers and sellers have just done, not what they will definitely do next.
What candlestick patterns are genuinely good at is narrowing your attention to moments where something meaningful just happened, a rejection, a stall, a sudden takeover, instead of treating every candle as equally important. Many experienced traders treat a pattern as raising a question (“has sentiment just shifted here?”) rather than answering one outright. The next few steps cover exactly how to turn that raised question into a more reliable read.
Step 10: Context Is Everything, Combining Patterns With Trend and Levels
The single biggest factor separating a meaningful candlestick pattern from pure noise is location. A hammer appearing after a long fall, right at a well tested support level, is a meaningful clue. The exact same hammer shape appearing in the middle of a quiet, flat stretch of price, with no nearby support, is far less meaningful.
This site’s Price Action Trading course covers support, resistance, demand and supply zones, and trend structure in full depth, and those ideas are exactly what turns a candlestick pattern from an interesting shape into part of a real trading decision. A pattern without context is a word without a sentence. Always ask: where is this happening, not just what is this shape?
Step 11: Using Volume to Confirm a Candlestick Pattern
Volume, how many shares or contracts traded during a candle’s time period, is one of the simplest ways to check whether a pattern has real force behind it. A bullish engulfing candle on unusually heavy volume generally carries more weight than the exact same shape on thin, quiet volume.
The logic is simple: a real, meaningful shift in sentiment usually involves a lot of real participants actually acting on it, not just a quiet, low conviction move that can easily reverse again. When a pattern and a volume spike show up together, many traders treat that combination as more trustworthy than either one alone.
Step 12: Reading Candlestick Patterns Across Multiple Timeframes
A bearish pattern on a 5 minute chart, in the middle of a strong daily uptrend, is a very different signal than the same pattern appearing on the daily chart itself. Always keep the bigger timeframe’s trend in mind before giving too much weight to a pattern on a smaller one.
A useful habit: treat a pattern on a higher timeframe (like daily or weekly) as a more significant event than the identical pattern on a very low timeframe (like 1 minute or 5 minute), simply because more time, and more real participants, went into forming it.
Step 13: Common Mistakes When Reading Candlesticks
- Treating a pattern as a guarantee. Every pattern in this course is a clue about recent sentiment, never a promise about what happens next.
- Ignoring where the pattern formed. The same shape means very different things at a key level versus in the middle of nowhere, as covered in Step 10.
- Acting on a pattern before it actually completes. A morning star is not complete until its third candle actually closes; acting on just the first two candles is acting on an unfinished story.
- Ignoring the bigger trend. A single bullish pattern fighting against a strong downtrend one timeframe higher has much lower odds than the same pattern aligned with the bigger trend.
- Seeing patterns that are not really there. The human eye is very good at finding familiar shapes in random data. Not every small wiggle is a real, meaningful pattern.
Step 14: A Simple Checklist Before Trading a Candlestick Pattern
Save this list, bookmark it, or share it with a friend who is learning alongside you. Go through it before trading any candlestick pattern.
- Has the pattern actually completed, including its final confirming candle if it needs one?
- Is this pattern forming at a meaningful location, a tested support, resistance, or zone, not a random spot?
- Does this pattern agree with, or at least not strongly fight against, the bigger trend on a higher timeframe?
- Is there a noticeable volume signal supporting this pattern, or is it on unusually quiet volume?
- Do I know exactly where my stop loss goes if this pattern fails?
- Am I reading this pattern calmly, or am I just looking for an excuse to enter a trade I already wanted to take?
Step 15: Quick Glossary, Every Pattern in One Place
A fast reference listing all 36 patterns from this course in one place. Bookmark this page and jump here any time a pattern name slips your memory.
- Doji: Open and close almost equal, pure indecision.
- Dragonfly Doji: Doji with a long lower wick, can signal a bottom.
- Gravestone Doji: Doji with a long upper wick, can signal a top.
- Hammer: Small body on top, long lower wick, bullish reversal after a downtrend.
- Hanging Man: Same shape as a hammer, but after an uptrend, a bearish warning.
- Inverted Hammer: Small body on bottom, long upper wick, bullish reversal after a downtrend.
- Shooting Star: Small body on bottom, long upper wick, bearish reversal after an uptrend.
- Spinning Top: Small body, long wicks both sides, indecision.
- Long Legged Doji: A doji with very long wicks on both sides, strong indecision.
- High Wave: Small body, extremely long wicks both ways, extreme volatility.
- Bullish / Bearish Marubozu: Full body, almost no wicks, total one sided control.
- Bullish / Bearish Engulfing: A candle’s body fully covers the prior opposite colored candle’s body.
- Piercing Line: A green candle closes above the midpoint of the prior red candle’s body.
- Dark Cloud Cover: A red candle closes below the midpoint of the prior green candle’s body.
- Tweezer Top / Bottom: Two candles sharing almost the same high, or the same low.
- Bullish / Bearish Harami: A small candle tucked completely inside the prior, much bigger, opposite colored candle.
- Harami Cross: A harami where the small inside candle is a doji.
- Belt Hold: A candle opening at its low (bullish) or high (bearish) with almost no wick on that side.
- Bullish / Bearish Kicker: Two candles with a gap and zero overlap, a sudden sentiment shift.
- Morning Star / Evening Star: A three candle reversal pattern, big candle, small pause, big opposite candle.
- Three White Soldiers / Three Black Crows: Three strong same direction candles in a row.
- Three Inside Up / Down: A harami confirmed by a third candle closing beyond the first candle’s open.
- Rising / Falling Three Methods: A strong candle, a brief contained pause, then a stronger candle continuing the same direction.
- Three Outside Up / Down: An engulfing pattern confirmed by a third candle extending the same direction.
- Bullish / Bearish Abandoned Baby: A rare three candle pattern with an isolated, gapped away doji in the middle.
Step 16: What to Do Next
These 36 patterns are the vocabulary. The Chart Patterns course on this site covers the bigger shapes built from many candles together, like head and shoulders and triangles. The Price Action Trading course brings candlestick patterns, chart patterns, support, resistance, and trend structure together into one complete trading approach.
But recognizing a pattern on a chart is only one half of becoming a consistent trader. The other half is the decision-making that happens once real money and real emotion are involved. Samir Dash’s ACE framework (Aware, Control, Execute) at Mindful Trading Hub focuses specifically on that second half, for traders who already know the patterns but still struggle to execute consistently under pressure.
Frequently Asked Questions
Which candlestick pattern is the most reliable?
No single pattern is reliable on its own, as explained in Step 9. Patterns that involve more candles and clearer confirmation, like a morning star or a three outside up, are generally considered more meaningful than a single candle shape alone, especially when combined with the context covered in Step 10.
Do I need to memorize all 36 patterns before I start trading?
No. Most traders naturally become familiar with a handful of patterns they see most often on their preferred charts and timeframes, and use this course as a reference for the rest. Recognizing the shape when you see it, even if you need to look up its exact name, is enough to get started.
What is the difference between a hammer and a hanging man?
They are the exact same candle shape. The only difference is where they appear: a hammer appears after a downtrend and can signal a bullish reversal, while a hanging man appears after an uptrend and can signal a bearish reversal, as covered in Step 3. This is a perfect example of why context, covered in Step 10, matters so much.
Should I trade the moment I spot a pattern, or wait for something else?
Many traders wait for the pattern to fully complete, including any confirming candle it needs, and check it against the context ideas in Steps 10, 11, and 12, rather than reacting to the very first candle that looks promising. Step 14’s checklist walks through this in full.
Is this investment advice?
No. Samir Dash is not SEBI-registered, and nothing in this course is a stock tip, investment recommendation, or promise of returns. This content is for educational purposes only, explaining how candlestick patterns work in general. Please read the Disclaimer before acting on anything you read here.
Related Reading on This Site
If you want to go deeper on specific ideas from this course, Samir Dash has written these on blog.samirdash.in:
- Candlestick Patterns: The Complete Guide for F&O Traders
- Doji Candlestick Pattern: What It Really Means
- Engulfing Candlestick Pattern: Bullish and Bearish
- Hammer and Hanging Man Candlestick Patterns Explained
- Advanced Candlestick Patterns: Multi-Candle Formations Explained
Continue Your Learning Path
You now know the vocabulary, 36 patterns worth of it. Here is where most readers go next.
- Chart Patterns: see how these same candles combine into larger chart structures.
- Price Action Trading: put candles and structure together into one complete reading approach.
You can also see every course on this site, in order, and pick your own path.
Want to trade with more clarity and less emotional reactivity? Samir Dash’s ACE framework (Aware, Control, Execute) helps traders build the decision-making discipline that pattern recognition alone can’t teach. Learn more at Mindful Trading Hub.