

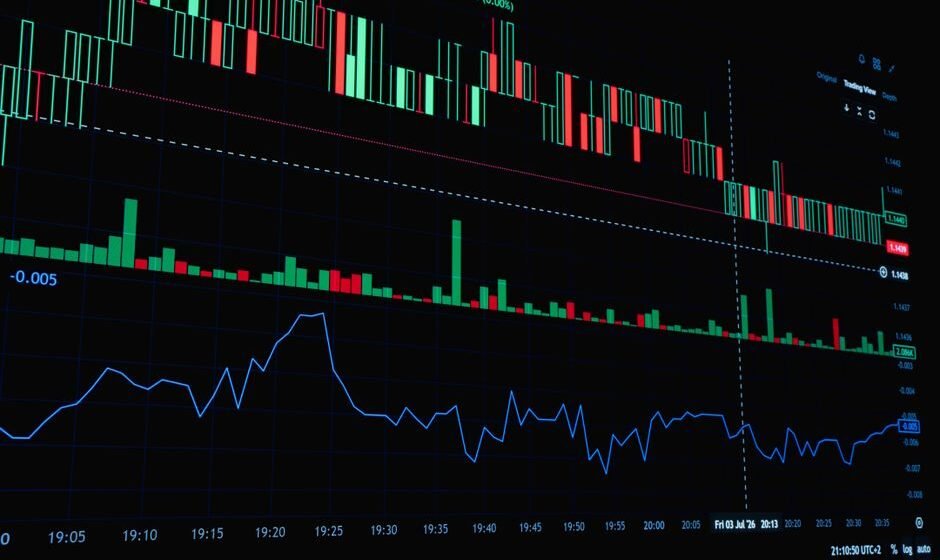

Technical analysis is the study of past price and volume data to try to understand what a stock might do next. Instead of looking at a company’s profits or business quality, it looks purely at the chart, the pattern of prices over time, to guide trading decisions.
This post is a true starting point. It explains what technical analysis actually is, what assumption it is built on, how it differs from the other major approach to picking stocks, and where to go next once you understand the basics. If you have not yet learned how to read a chart at all, start with our guide on how to read a stock chart for beginners first, or go all the way back to the basics with how the stock market actually works.
The core idea behind technical analysis
Technical analysis rests on one central assumption: that price movement contains useful information, because it reflects the combined buying and selling decisions of every trader and investor active in that stock. Rather than trying to independently judge whether a company is a good business, a technical analyst studies how the price itself has behaved, on the theory that price already reflects everything currently known and felt about that stock by the people trading it.
This leads to a few common working principles in technical analysis:
- Price tends to move in trends, rather than randomly, at least for periods of time. A stock that has been rising tends to keep finding buyers for a while, and a stock that has been falling tends to keep finding sellers.
- History tends to rhyme. Certain price patterns, like a stock repeatedly bouncing off a particular price level, tend to repeat because human behaviour around fear and greed tends to repeat.
- Volume confirms conviction. A price move on high trading volume is generally considered more meaningful than the same move on very low volume.
None of these are guarantees. They are working assumptions that a large number of market participants act on, which is partly why they tend to hold up often enough to be useful.
What technical analysis actually looks at
In practice, technical analysis uses a handful of core tools, layered on top of a basic price chart:
- Candlestick charts, which show open, high, low, and close prices for each period, as covered in our beginner chart-reading guide.
- Support and resistance, price levels where a stock has repeatedly reversed direction in the past.
- Trend lines, lines drawn connecting a series of highs or lows to visualise the general direction of price.
- Indicators, mathematical calculations based on price and volume, such as moving averages (which smooth out price into an average line) or the RSI (which measures how fast and how far price has recently moved).
- Chart patterns, recognisable shapes that price sometimes forms, such as a head and shoulders or a double top, that some traders use as signals.
A beginner does not need to learn all of these at once. Most experienced technical analysts actually use a small number of tools consistently, rather than trying to apply every available indicator to every chart.
Technical analysis versus fundamental analysis
These are the two major approaches to deciding what to buy or sell, and they ask very different questions.
| Technical Analysis | Fundamental Analysis |
|---|---|
| Studies price and volume charts | Studies company financials and business quality |
| Asks: “What is the price doing, and when might I enter or exit?” | Asks: “Is this a good business, worth owning at this price?” |
| Commonly used for shorter-term trading decisions | Commonly used for longer-term investing decisions |
| Tools: candlesticks, indicators, chart patterns | Tools: earnings reports, balance sheets, industry analysis |
These approaches are not enemies. Many traders and investors use a mix of both, for example choosing fundamentally strong companies to watch, then using technical analysis to decide when to actually enter a position. Neither approach is universally “better.” They answer different questions and suit different goals.
A simple example of technical analysis in action
Suppose a trader is watching Nifty. Over the last few weeks, every time Nifty has fallen close to 24,200, it has found buyers and bounced back up. The trader marks 24,200 as a support level, a price where buying pressure has repeatedly shown up.
If Nifty falls toward 24,200 again, the trader might watch closely for signs of buyers stepping in again, such as a green candle forming right around that level with higher than usual volume, before considering a trade. This is technical analysis: using how price has behaved at a specific level in the past to inform a decision in the present. It is not a guarantee that 24,200 will hold again. It is a pattern worth watching, nothing more certain than that.
What technical analysis cannot do
It is worth being direct about the limits here, since this is one of the most misunderstood parts of trading.
- It cannot predict the future with certainty. It identifies patterns and probabilities, not guarantees.
- It does not remove the need for risk management. A well-identified technical setup can still fail, which is why a stop loss remains necessary regardless of how confident the chart pattern looks.
- It works differently across different market conditions. A method that works well in a trending market can perform poorly in a choppy, sideways one.
Technical analysis is a tool for organising decisions around price. It is not a formula that removes uncertainty from trading.
A short history of where this comes from
Technical analysis is not a recent invention. Its roots trace back to work done in the late 1800s by Charles Dow, a financial journalist whose observations about market trends eventually became known as Dow Theory, one of the earliest structured approaches to studying price behaviour. Candlestick charting itself is even older, developed in Japan centuries ago by rice traders trying to track price movement in rice markets.
Over the last several decades, technical analysis has grown far more structured, with computers now able to calculate hundreds of indicators instantly and scan thousands of stocks for specific patterns in seconds, something that used to take a human analyst hours of manual chart drawing. The underlying idea, though, has not changed. It is still fundamentally about studying how price has behaved to inform a decision about how it might behave next.
Common mistakes beginners make with technical analysis
A few patterns show up repeatedly among people newly learning this subject, and knowing them in advance can save real money.
- Using too many indicators at once. Loading a chart with ten different indicators often produces conflicting signals, one saying buy while another says sell, which leads to confusion rather than clarity.
- Treating patterns as certainties. A recognisable chart pattern raises the odds of a certain outcome. It does not guarantee it. Trading a pattern as if it cannot fail is a common and costly beginner error.
- Ignoring the broader trend. A specific setup on a short timeframe can look convincing while going directly against the larger trend on a daily or weekly chart, which often reduces its reliability.
- Skipping risk management because the setup “looks perfect.” No technical setup, no matter how clean, removes the need for a stop loss.
Where to go next
Once the basic idea here makes sense, the natural next steps are learning to read individual candlestick patterns in more depth, understanding specific chart patterns, and learning how a small number of indicators actually work. Those are deeper, more technical topics covered elsewhere on this site, and they build directly on the foundation in this post.
Frequently asked questions
What is technical analysis in simple words?
Technical analysis is using a stock’s past price and trading volume, shown as a chart, to make decisions about buying or selling, rather than studying the company’s business or financials directly.
Is technical analysis reliable?
It identifies patterns and probabilities based on how price has behaved before, not guarantees. It is one input among several, and it works best combined with clear risk management rather than used alone as a prediction tool.
Do I need technical analysis to invest in stocks?
No, particularly for long-term investing, where fundamental analysis of a company’s business is usually more relevant. Technical analysis becomes more useful the shorter your holding period gets, especially for intraday and swing trading.
What is the difference between technical analysis and chart reading?
Chart reading is the basic skill of understanding what a chart shows, candles, price, and time. Technical analysis is the broader practice of using that chart, along with tools like indicators and patterns, to make actual trading decisions.
Can technical analysis predict the exact price a stock will reach?
No. It can highlight levels and patterns worth paying attention to, but it cannot predict an exact future price with certainty. Anyone claiming otherwise is overselling what the tool actually does.
What technical analysis will not teach you
Understanding technical analysis, what it is, what it assumes, and how to use its basic tools, is genuinely useful knowledge. But it does not teach you what to do when a textbook-perfect setup fails, or when you hesitate on a valid signal because the last three trades lost money. That part, staying disciplined when the chart and your emotions disagree, is not a technical analysis skill. It is a decision-making skill, and it is usually the real difference between traders who study charts well and traders who profit from them consistently.
Chart aapko sambhavna dikhata hai, faisla aap khud lete hain.
Related reading:
- What Is Trading? A Complete Beginner to Advanced Guide
- Candlestick Patterns: The Complete Guide for F&O Traders
- Price Action Trading: A Practical Guide
Understand the indicators but still hesitate or override your own signals? I run a free live session twice a week for traders with two or more years of experience who know the setups but still cannot execute under pressure. Register for the next free session here.
I am Samir Dash, founder of Mindful Trading Hub. I work with experienced traders on live market decision-making. More about my story here.