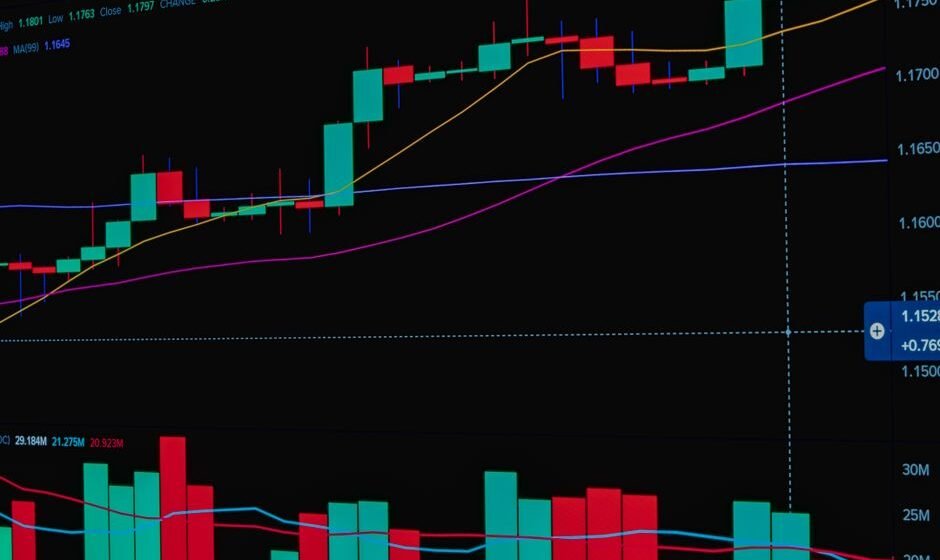

Bank Nifty technical analysis is not the same exercise as Nifty technical analysis, even though the charts look similar at first glance. The index is built differently, it moves differently, and a few of the habits that work fine on Nifty will actively hurt you on Bank Nifty.
This post covers the specific differences, why they exist, and what to actually change in how you read the Bank Nifty chart.
Why Bank Nifty is not just “Nifty but faster”
Most traders treat Bank Nifty as a leveraged version of Nifty. Same logic, bigger candles. That is close enough to be dangerous.
The real reason Bank Nifty behaves differently comes down to what is inside it. Bank Nifty is built from around 12 banking stocks, and just two of them, HDFC Bank and ICICI Bank, make up a large share of the total weight. Nifty, by comparison, is spread across 50 stocks from many sectors. When a heavily weighted stock like HDFC Bank moves sharply on its own news, Bank Nifty can move hard even if the rest of the market is quiet. Nifty rarely does that, because no single stock in it carries anywhere close to that much weight.
This single fact explains most of the practical differences below.
Difference 1: Wider, messier candles
Open a Bank Nifty 5-minute chart next to a Nifty 5-minute chart on the same day. Bank Nifty candles are usually wider, with longer wicks and more false breaks of small levels.
This happens because Bank Nifty’s concentration in a handful of stocks means it reacts faster and harder to individual stock moves, bank-specific news, and RBI policy related headlines. A single large order in HDFC Bank or ICICI Bank can push Bank Nifty several points in seconds.
What this means for your chart reading: a level that looks “broken” on Bank Nifty because of a five-point wick through it deserves more skepticism than the same-looking break on Nifty. Wait for a candle to close beyond a level on Bank Nifty before treating it as a real break. On Nifty you can sometimes get away with reacting to the wick. On Bank Nifty that habit gets you stopped out on noise repeatedly.
Difference 2: Levels need more room
Because Bank Nifty moves in bigger point swings, support and resistance zones need to be drawn as zones, not single lines.
- On Nifty, a level at 24,800 might hold within a 10 to 15 point band.
- On Bank Nifty, a level at 51,200 might need a 40 to 60 point band to be respected, simply because the index moves in larger absolute point increments.
If you draw Bank Nifty support and resistance as thin single lines the way you might on Nifty, you will see price “break” your level constantly, when what actually happened is the level held within its normal range of noise. Widen your zones on Bank Nifty. This alone fixes a large share of the false signals traders complain about.
Difference 3: Watch the heavyweight stocks, not just the index
On Nifty, checking two or three stocks before a trade is a nice-to-have. On Bank Nifty, it is close to mandatory.
Before trading a Bank Nifty setup, glance at the chart of HDFC Bank and ICICI Bank specifically. If Bank Nifty is showing a bullish setup but HDFC Bank is breaking down hard on its own chart, that is useful information the index chart alone will not tell you clearly, because HDFC Bank’s decline is dragging the index down and might reverse the setup before it plays out.
This is not about predicting the stock. It is about not being surprised when the index does something the leading stocks were already signalling.
Difference 4: Bank-specific news moves this index harder
Interest rate decisions, RBI policy announcements, and quarterly results of large banks all move Bank Nifty more than they move Nifty. Nifty absorbs banking-sector news across only about a third of its weight. Bank Nifty absorbs it across all of it.
Before trading Bank Nifty on any given day, it is worth a quick check of whether an RBI policy statement, a major bank’s results, or any large banking-sector headline is scheduled. A technically clean setup can still get overrun by a scheduled event the chart itself has no way of showing you.
Difference 5: Options behave differently too
Bank Nifty options carry higher premium per point than Nifty options relative to their typical range, because the index itself moves in bigger absolute swings. This changes position sizing math. The same rupee risk on Bank Nifty options often means a smaller lot or tighter stop than the equivalent Nifty trade, simply because each point of movement is worth more.
If you use the same stop-loss point distance on Bank Nifty that you use on Nifty out of habit, you are usually taking on more rupee risk than you intend, without realising it, because Bank Nifty’s points are simply worth more in premium terms.
Difference 6: Volatility clusters differently around events
Nifty’s volatility tends to build up gradually around big macro events, global cues, budget days, election results, because that news affects the whole spread of 50 stocks over time. Bank Nifty’s volatility often arrives in sharper, shorter bursts tied to specific banking events, an RBI rate decision at a fixed time, or a large bank’s results dropping right at the open.
Practically, this means the “quiet before the event, sharp move after” pattern is more pronounced on Bank Nifty. A trader who is used to Nifty’s slower build-up can be caught off guard by how compressed the actual move is on Bank Nifty once the trigger hits. Checking the exact time of a scheduled event, not just the date, matters more here than it does for Nifty.
What stays the same
It is worth being clear that the core method of technical analysis does not change. Trend, support, resistance, volume, and moving averages all still apply to Bank Nifty exactly as they do to any other chart. Nothing here is a new system. These are six adjustments to how you apply the same system to an index with a different internal structure.
A simple adjustment checklist
- Draw support and resistance as wider zones, not thin lines.
- Wait for a candle close beyond a level, not just a wick, before calling it a break.
- Check HDFC Bank and ICICI Bank charts before taking a Bank Nifty trade.
- Check for scheduled RBI policy dates or major bank results before the trading day.
- Recalculate your stop-loss in rupee terms, not just points, given the higher premium per point.
- Note the exact time of any scheduled banking event, not just the date, since moves tend to cluster tightly around it.
Where the chart is not the whole story
Bank Nifty’s sharper, faster candles put more pressure on a trader in the moment than Nifty usually does. A stop that would feel manageable on Nifty can feel much more urgent on Bank Nifty simply because it gets hit faster and with a bigger single move. Traders who are comfortable following their plan on Nifty sometimes find themselves reacting on impulse the first time a fast Bank Nifty candle runs through their stop. The chart analysis was not wrong. The speed of the move made it harder to sit still and let the plan play out.
Frequently asked questions
Is Bank Nifty harder to trade than Nifty?
It is not harder in terms of the analysis method, but it does move faster and with bigger point swings, which raises the bar on position sizing discipline and on waiting for candle closes rather than reacting to wicks.
Why does Bank Nifty gap more than Nifty on some days?
Because a large share of its weight sits in a small number of stocks, overnight news on any one of those stocks, especially HDFC Bank or ICICI Bank, can move the whole index at the open, something that takes a much bigger combined event to do on the more spread-out Nifty.
Should I use the same support and resistance rules on Bank Nifty as Nifty?
The same logic applies, but the zones need to be wider on Bank Nifty to account for its larger typical point range. A rule that works with a 10-point buffer on Nifty often needs 30 to 50 points on Bank Nifty.
Do moving averages work the same way on Bank Nifty?
Yes, the 20-day and 50-day moving averages are read the same way for trend context. They just need to be checked alongside a look at the heavyweight bank stocks, since a moving average crossover on the index can be driven disproportionately by one or two names.
How much does RBI policy actually affect Bank Nifty compared to Nifty?
Meaningfully more, because banking stocks are a much larger share of Bank Nifty’s total weight than they are of Nifty’s. It is worth checking the RBI policy calendar specifically when planning Bank Nifty trades, even if you do not check it for Nifty trades.
The real point
Bank Nifty is not a different sport. It is the same technical analysis, applied to an index with fewer, heavier moving parts. Once you widen your zones, watch the two heavyweight stocks, and respect candle closes over wicks, most of the “Bank Nifty is unpredictable” complaint quietly disappears.
Chart same hai, lekin Bank Nifty thoda tez chalta hai, isliye zyada dhyan chahiye.
Related reading:
- How to Choose the Right Trading Timeframe for You
- Moving Averages: How Traders Actually Use Them
- The First 60 Seconds After You Enter a Trade
Reading Bank Nifty’s faster candles correctly is only half the job. I run a free live session twice a week for traders with two or more years of experience who know the setups but still cannot execute under pressure. Register for the next free session here.
I am Samir Dash, founder of Mindful Trading Hub. I work with experienced traders on live market decision-making. More about my story here.