

Chart Patterns
This is a complete, dedicated course on chart patterns, the bigger shapes that form over many candles together, not a single candle or a small handful of them. If the Candlestick Patterns course taught you words, this course teaches you full paragraphs, the larger structures traders watch for on a price chart.
This is a full course, not a short article, so it covers reversal patterns, continuation patterns, and the less common but still important ones, each with a clear picture. Bookmark this page. Come back to it any time you spot a bigger shape forming on a real chart and need to put a name to it.
A free course by Samir Dash, founder of Mindful Trading Hub.
What You Will Learn
- Step 1: What Makes a Chart Pattern Different From a Candlestick Pattern
- Step 2: Quick Recap, Head and Shoulders
- Step 3: Quick Recap, Double Top and Double Bottom
- Step 4: Triple Top and Triple Bottom
- Step 5: Rounding Bottom and Rounding Top
- Step 6: Cup and Handle
- Step 7: Diamond Pattern
- Step 8: Rectangle Pattern
- Step 9: The Three Types of Triangles
- Step 10: Broadening Pattern (Megaphone)
- Step 11: Pennant vs Flag
- Step 12: Measuring Price Targets From Chart Patterns
- Step 13: Confirming a Chart Pattern With Volume
- Step 14: Reversal vs Continuation, How to Tell Which Type You Are Looking At
- Step 15: Common Mistakes When Trading Chart Patterns
- Step 16: A Simple Checklist Before Trading a Chart Pattern
- Step 17: Quick Glossary, Every Pattern in One Place
- Step 18: What to Do Next
- Frequently Asked Questions
Step 1: What Makes a Chart Pattern Different From a Candlestick Pattern
A candlestick pattern, covered in this site’s dedicated Candlestick Patterns course, is built from just one to three candles and tends to play out quickly. A chart pattern is a bigger shape, built from many candles over a longer stretch of time, sometimes weeks or months, showing a broader story of where buyers and sellers have been fighting, and who is starting to win.
Chart patterns generally fall into two families. Reversal patterns suggest an existing trend may be ending and turning the other way. Continuation patterns suggest a brief pause in an existing trend before it carries on in the same direction. This course covers the most useful patterns from both families, clearly marking which is which.
Step 2: Quick Recap, Head and Shoulders
This pattern is also covered in the Price Action Trading course on this site, so here is a quick recap before moving into newer ground.
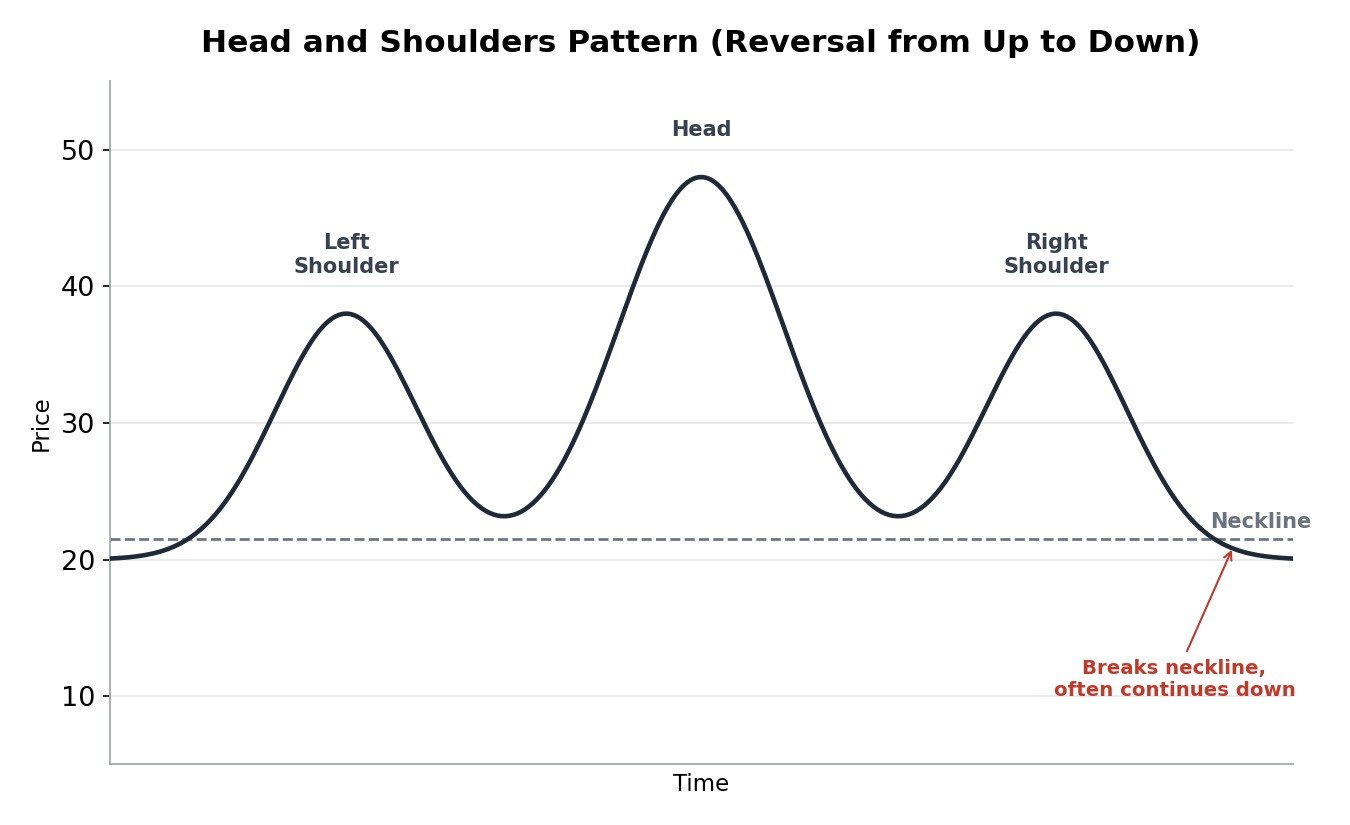
Three rounded peaks form after an uptrend, with the middle peak (the head) clearly taller than the two similar height shoulders on either side. A line connecting the two low points, called the neckline, is watched for a confirmed break as the real reversal signal. An Inverse Head and Shoulders is the same idea upside down, signaling a reversal from a downtrend into an uptrend.
Step 3: Quick Recap, Double Top and Double Bottom
Also covered in the Price Action Trading course, here is the quick version.
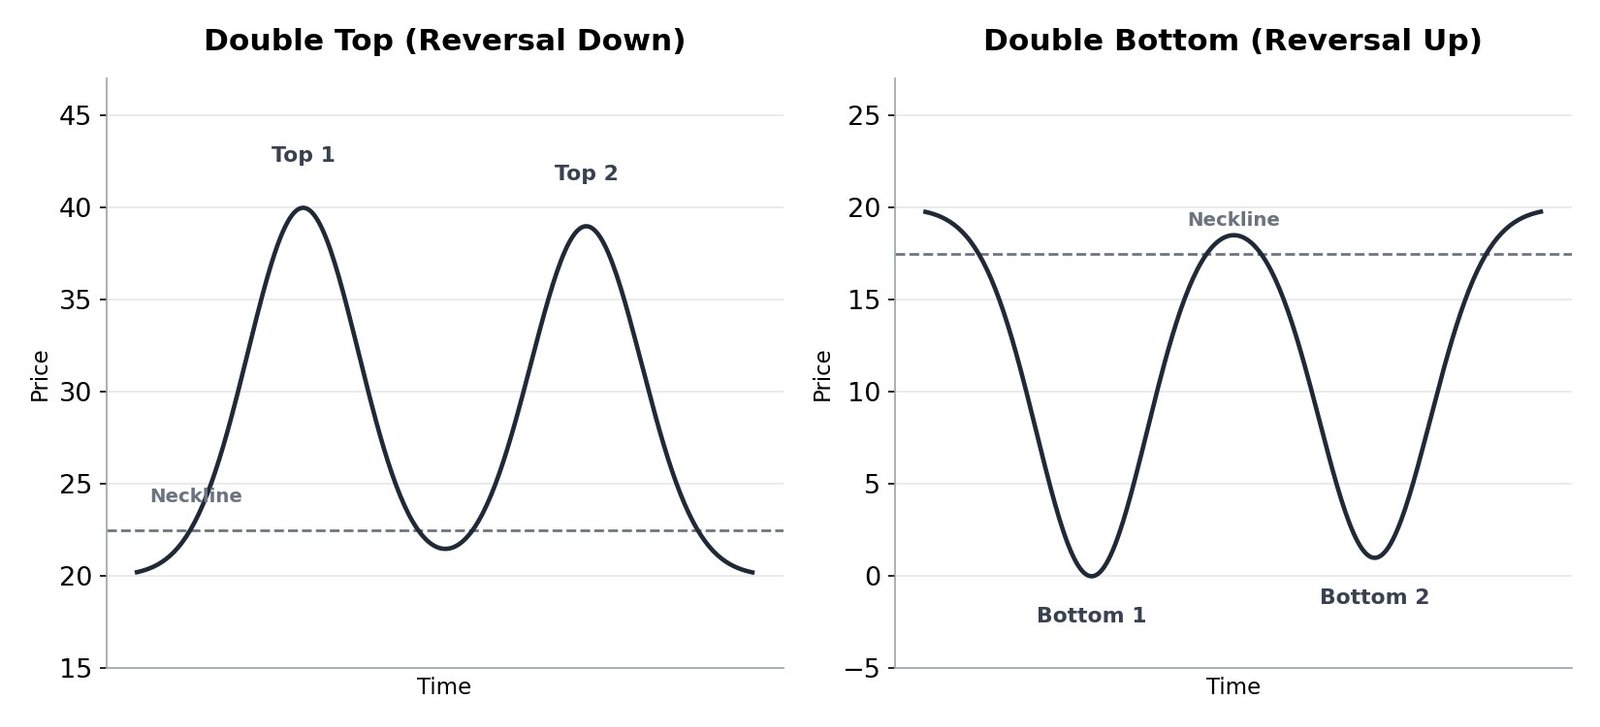
A Double Top forms as two peaks at a similar height, shaped like the letter M, suggesting buyers failed twice at the same level. A Double Bottom forms as two troughs at a similar depth, shaped like the letter W, suggesting sellers failed twice at the same level. Both are reversal patterns, confirmed by a break of the neckline between the two peaks or troughs.
Step 4: Triple Top and Triple Bottom
A natural extension of the double top and double bottom, using three attempts at a level instead of two.
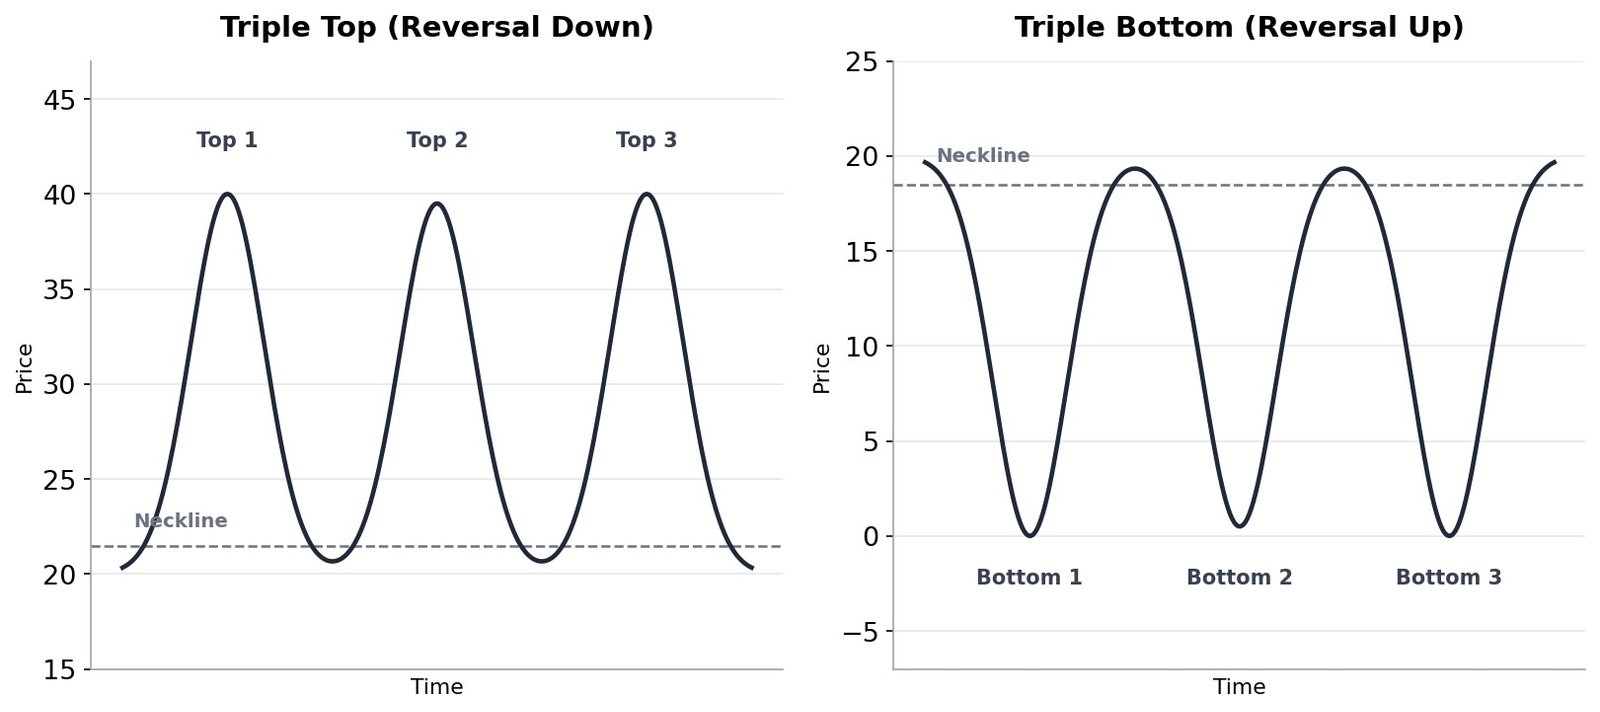
A Triple Top forms as three peaks at a similar height, a reversal pattern suggesting buyers have now failed three separate times at the same resistance. A Triple Bottom is the mirror image, three troughs at a similar depth, suggesting sellers have failed three times at the same support. Because the level has been tested more times, many traders view a confirmed triple top or bottom as a slightly stronger signal than a double top or bottom, though it is also a rarer pattern to see clearly formed.
Step 5: Rounding Bottom and Rounding Top
Unlike the sharper peaks and troughs covered so far, these two patterns form very slowly and smoothly, without any sharp turning point at all.
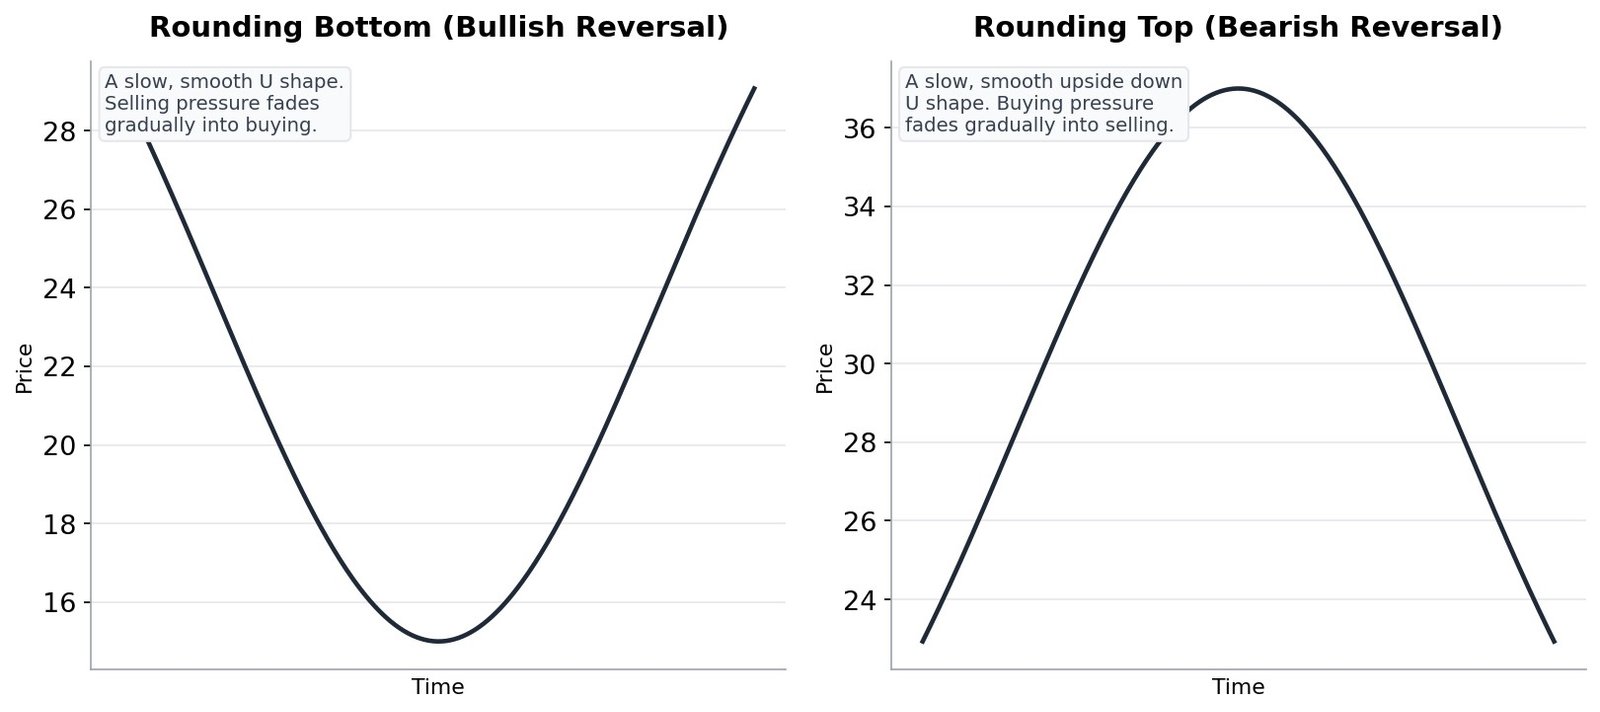
A Rounding Bottom, sometimes called a saucer, shows selling pressure fading away very gradually and buying pressure slowly taking over, forming a smooth U shape, a reversal pattern from a downtrend into an uptrend. A Rounding Top is the mirror image, buying pressure gradually fading into selling, forming a smooth upside down U, a reversal pattern from an uptrend into a downtrend. Because they form so slowly, these patterns are usually easier to spot on higher timeframes like daily or weekly charts, covered further in Step 14.
Step 6: Cup and Handle
This pattern builds directly on the rounding bottom from Step 5, adding one more small step at the end.
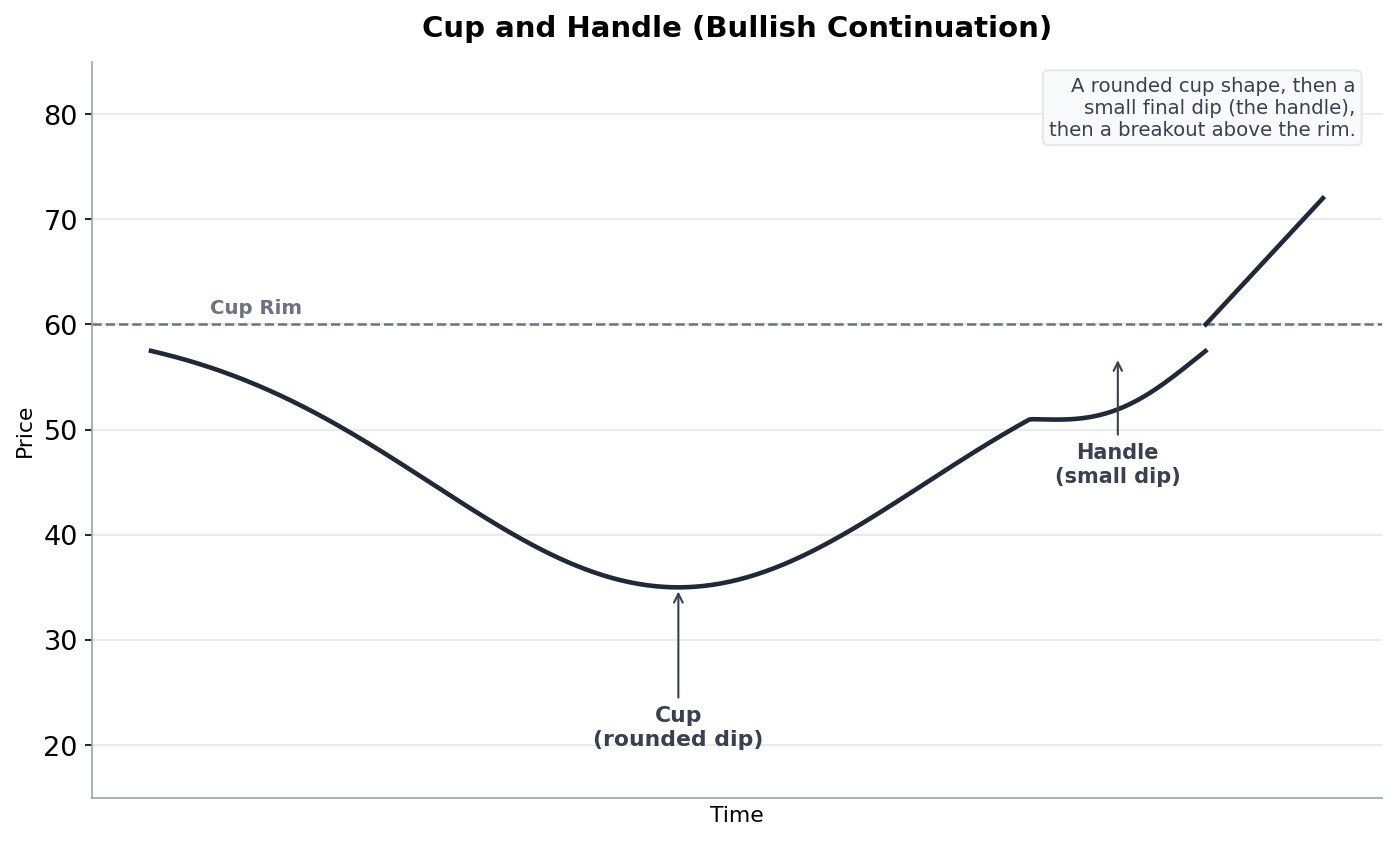
Price forms a rounded cup shape, similar to a rounding bottom, recovering back up toward its starting level (the rim). Then, instead of breaking out immediately, price dips one more time in a smaller, shorter pullback, called the handle, often drifting slightly downward or sideways. A confirmed breakout above the cup’s rim completes the pattern. It is generally considered a bullish continuation pattern, most often appearing within an existing uptrend rather than as a pure reversal.
Step 7: Diamond Pattern
One of the less common patterns on this list, but worth recognizing by shape, since it combines two ideas from later in this course into one.
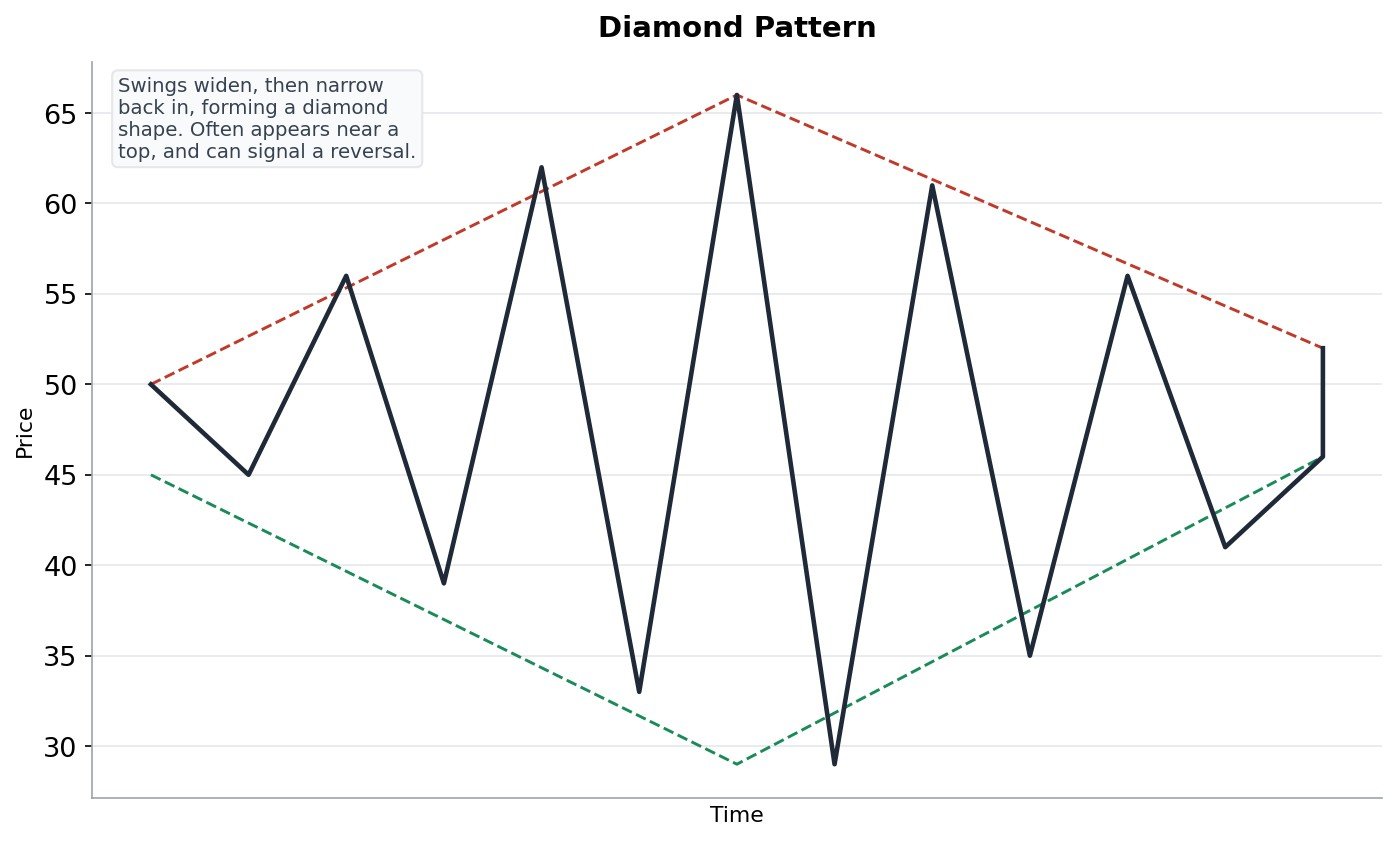
Price swings first get wider (similar to the broadening pattern in Step 10), then gradually narrow back in (similar to a triangle in Step 9), together tracing out a shape that looks like a diamond, or rhombus, on the chart. It most often appears near the top of an existing uptrend and is generally treated as a reversal pattern, though it is rare enough that many traders go a long time without seeing a clean example.
Step 8: Rectangle Pattern
This pattern is simply the range-bound market idea, covered in the Price Action Trading course, viewed through the lens of a named chart pattern.
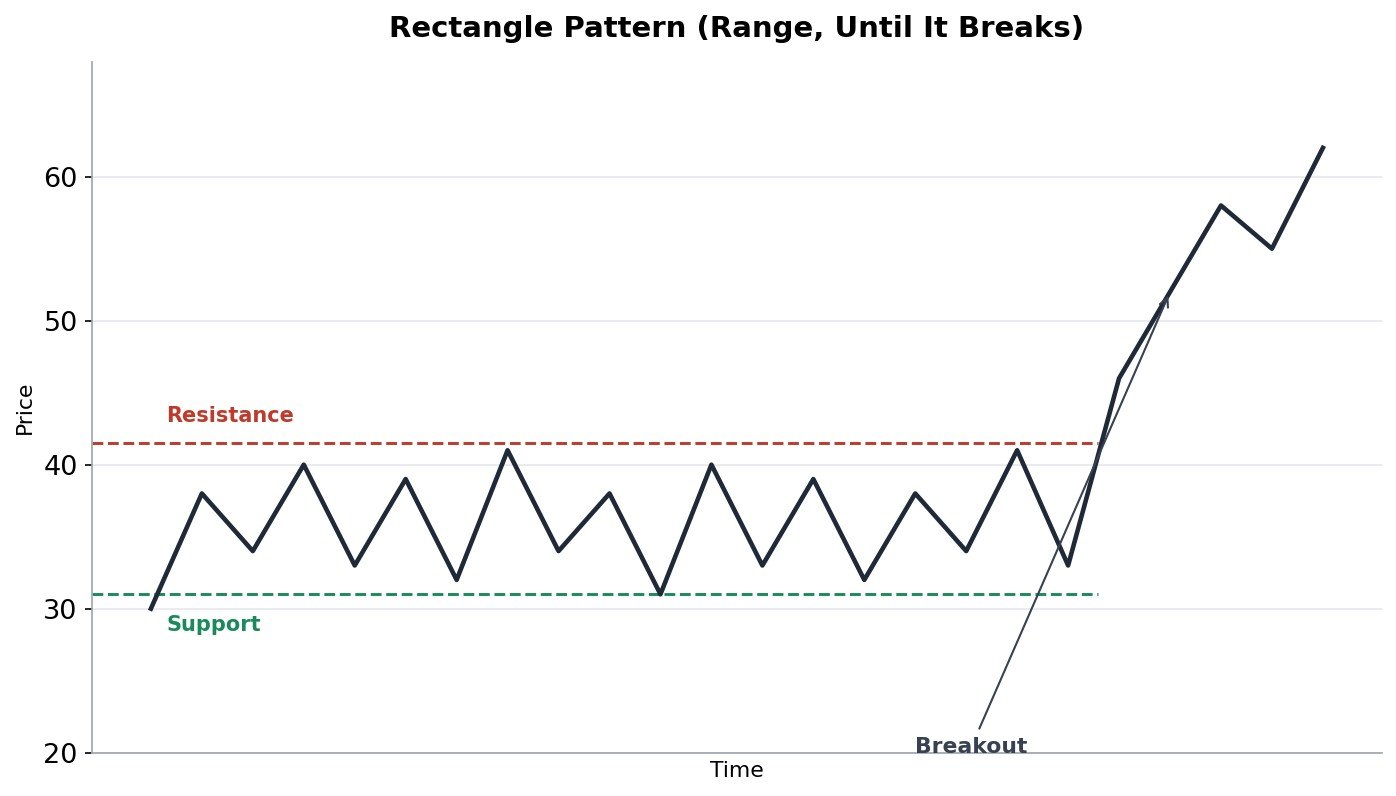
Price repeatedly bounces between a fairly flat support level below and a fairly flat resistance level above, with no clear higher highs or lower lows forming in between. A rectangle can resolve as either a reversal or a continuation, depending on the trend before it formed, which is exactly why the breakout direction, not the pattern itself, is what traders actually act on.
Step 9: The Three Types of Triangles
Triangles are among the most common chart patterns, and come in three distinct types, each with a different bias.
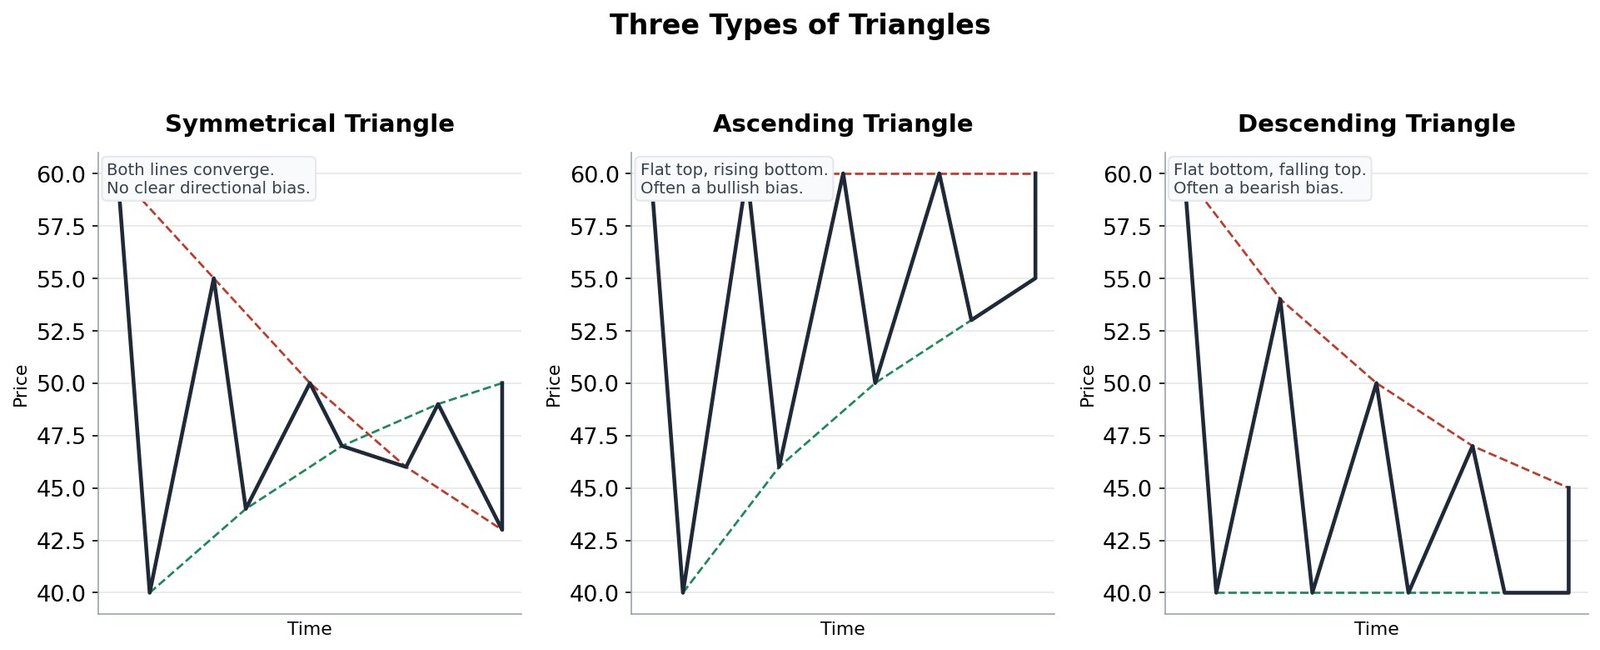
A Symmetrical Triangle has both its upper and lower trendlines converging toward each other, with no particular directional bias, the eventual breakout direction is what actually matters. An Ascending Triangle has a flat upper resistance line and a rising lower trendline, generally considered to carry a bullish bias, since buyers are willing to step in at progressively higher prices. A Descending Triangle has a flat lower support line and a falling upper trendline, generally considered to carry a bearish bias, for the mirror image reason.
Step 10: Broadening Pattern (Megaphone)
This pattern is the direct opposite of a triangle, and is generally seen as a sign of real instability in a market rather than a clean, tradeable setup on its own.
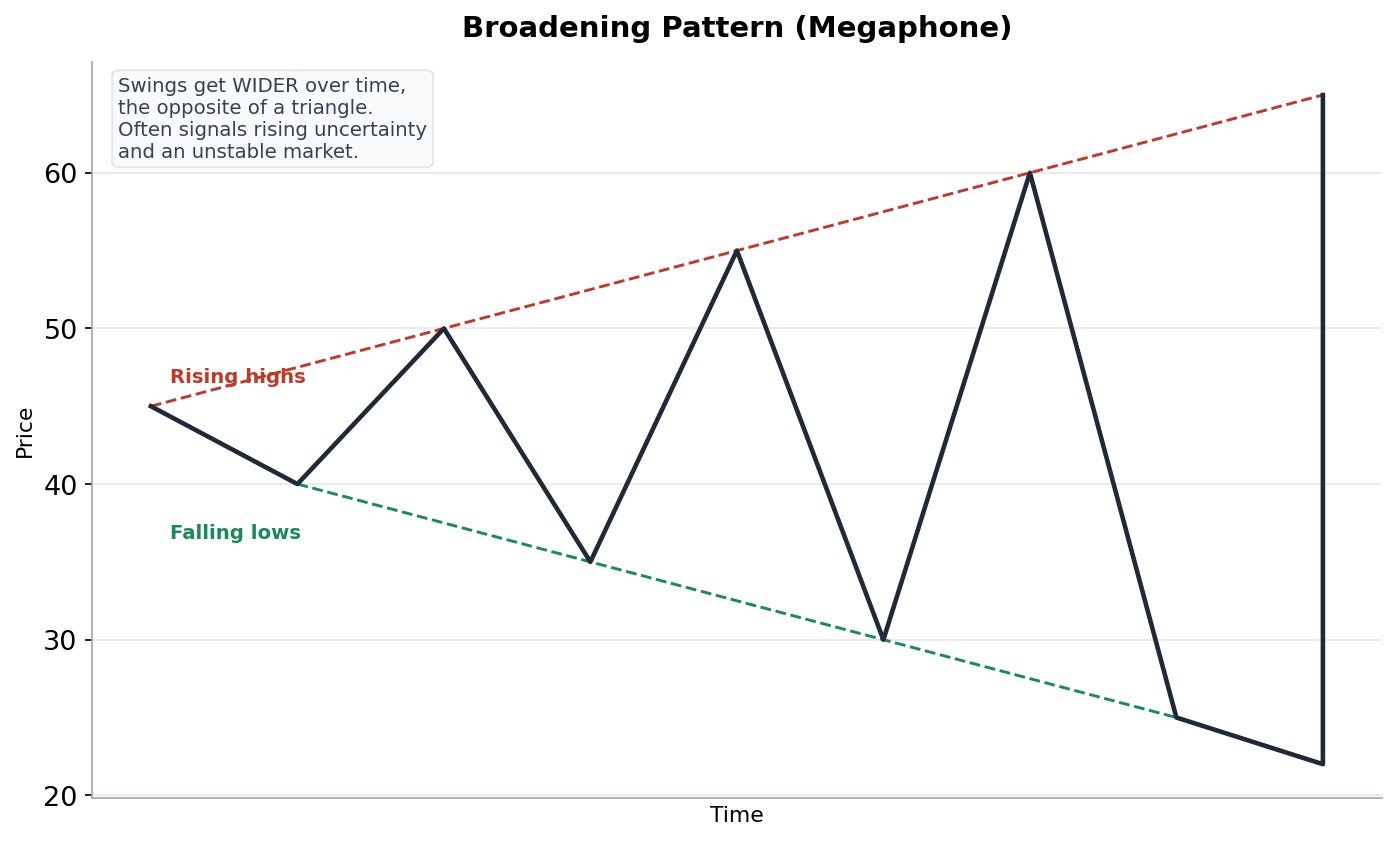
Instead of converging, each new high is higher than the last and each new low is lower than the last, so the two trendlines drawn along the swings spread further apart over time, resembling a megaphone. It often reflects a market where participants strongly disagree about fair value, leading to increasingly wild swings in both directions. Many traders consider a broadening pattern one of the harder, lower odds setups to trade cleanly, precisely because it represents rising disorder rather than a build up toward a clear resolution.
Step 11: Pennant vs Flag
These two continuation patterns are often confused with each other, since both form the same way, as a short pause after a sharp move, but their shapes are genuinely different.
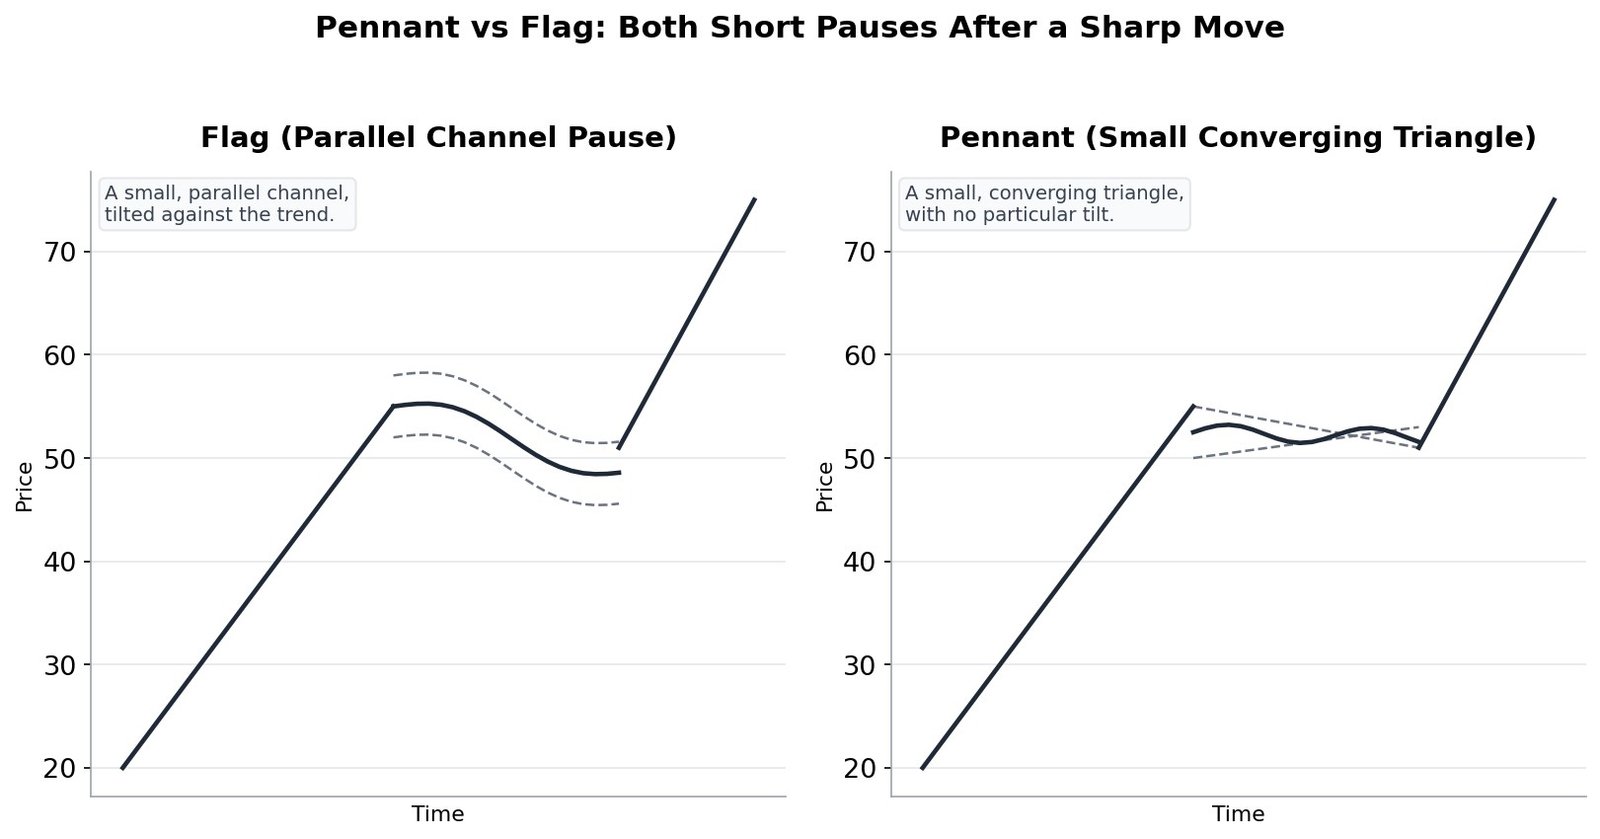
A Flag pauses inside a small, narrow, roughly parallel channel, usually tilted slightly against the direction of the prior sharp move. A Pennant pauses inside a small, narrow, converging triangle instead, with no particular tilt, essentially a miniature version of the symmetrical triangle from Step 9. Both are generally read the same way: a brief rest before the prior strong move is expected to continue in the same direction.
Step 12: Measuring Price Targets From Chart Patterns
Most of the patterns in this course come with a simple way to estimate how far price might move after a confirmed breakout, called a measured move.
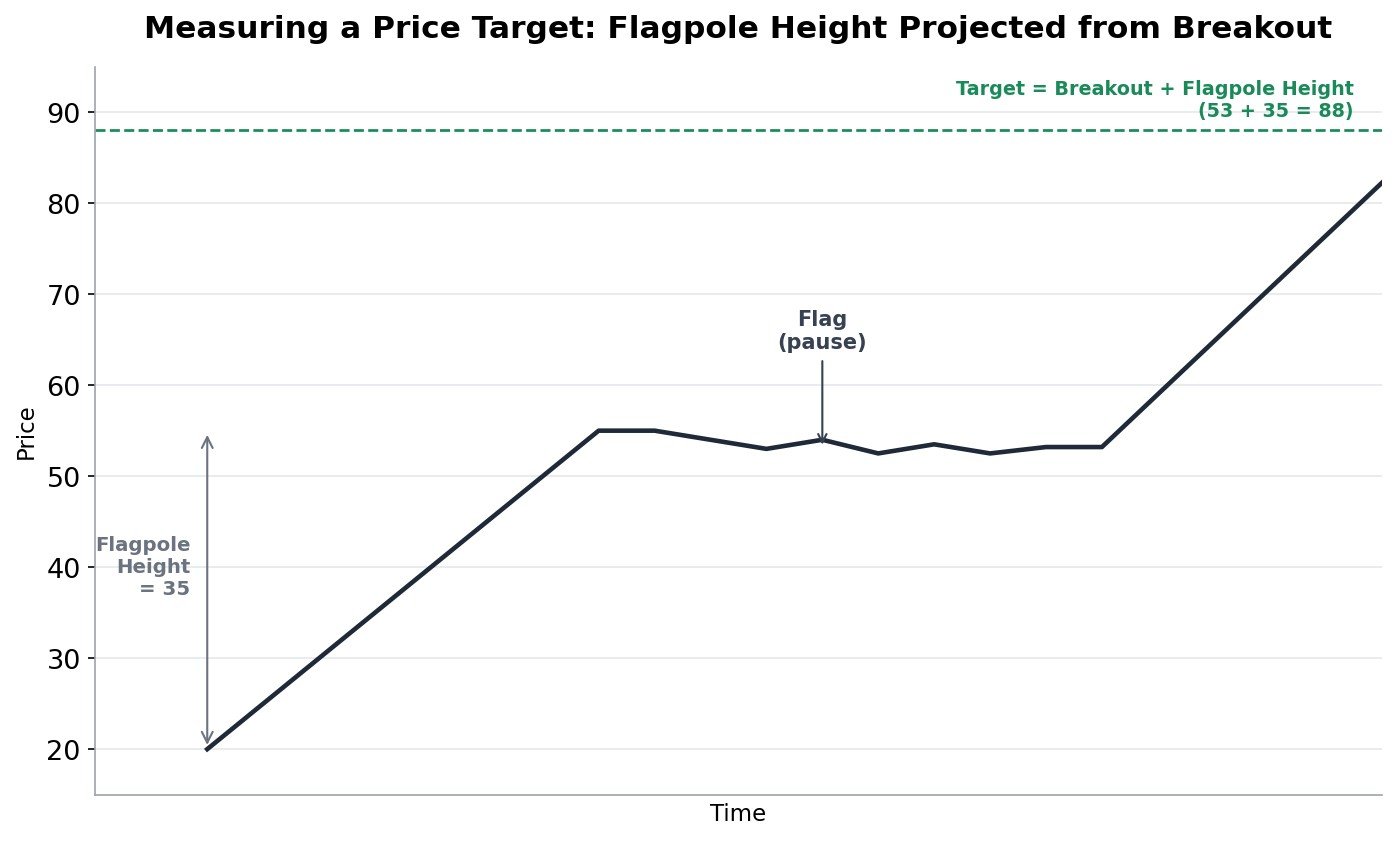
For a head and shoulders, double top, or triple top, measure the vertical distance from the highest peak down to the neckline, then project that same distance downward from the point where the neckline actually breaks. For a flag or pennant, measure the height of the sharp move before the pause (the pole), then project that same height forward from the breakout point, exactly as shown in the picture above. For a rectangle or triangle, measure the height of the pattern at its widest point, then project that distance from the breakout.
A measured move is a planning tool, not a guarantee. Price often falls short of, or runs past, the exact projected distance. It works best as one input for setting a realistic first target, alongside the risk and reward thinking every trade should include.
Step 13: Confirming a Chart Pattern With Volume
Volume, how many shares or contracts traded during a given period, is one of the simplest ways to judge whether a chart pattern’s eventual breakout has real force behind it, rather than being a weak, easily reversed move.
A breakout from any pattern in this course, on noticeably higher volume than the pattern’s quiet consolidation phase, is generally considered more trustworthy than the identical breakout on thin, unremarkable volume. Many traders specifically wait to see this volume pickup before fully committing to a pattern’s breakout, rather than acting purely on the shape alone.
Step 14: Reversal vs Continuation, How to Tell Which Type You Are Looking At
Every pattern in this course falls into one of two families, and knowing which one you are looking at changes what you should expect next.
Reversal patterns (head and shoulders, double and triple tops and bottoms, rounding top and bottom, and often a diamond) suggest the existing trend is running out of steam and may turn the other way. Continuation patterns (flags, pennants, and often triangles and rectangles, depending on which way they eventually break) suggest a brief pause before the existing trend carries on. A useful habit: always note the trend before the pattern even started forming, since that context is exactly what tells you whether a given pattern is more likely acting as a reversal or a continuation in this specific case.
Step 15: Common Mistakes When Trading Chart Patterns
- Acting before the pattern actually confirms. A head and shoulders without a broken neckline, or a triangle without a confirmed breakout, is still just a developing shape, not a finished signal.
- Forcing a pattern onto a messy chart. Not every stretch of price action is a clean, tradeable pattern. Some charts are genuinely just noisy, and that is fine to recognize and walk away from.
- Ignoring the trend before the pattern formed. As covered in Step 14, this context is what tells a reversal pattern apart from a continuation one.
- Skipping the volume check from Step 13. A breakout with no real volume behind it fails far more often than one with clear participation.
- Treating the measured move from Step 12 as a guarantee instead of a helpful planning estimate.
- Trading on a timeframe too small to show the pattern clearly. Bigger, slower patterns like a rounding bottom or a cup and handle are usually easier to see cleanly on daily or weekly charts than on a 5 minute chart.
Step 16: A Simple Checklist Before Trading a Chart Pattern
Save this list, bookmark it, or share it with a friend who is learning alongside you. Go through it before trading any chart pattern.
- Has the pattern actually confirmed with a real breakout, not just a shape that looks right so far?
- Do I know whether this is acting as a reversal or a continuation, based on the trend before it formed?
- Is there a noticeable volume increase on the breakout, or is it on quiet, unremarkable volume?
- Have I measured a realistic price target using the technique from Step 12?
- Do I know exactly where my stop loss goes if the breakout turns out to be a fakeout?
- Am I seeing this pattern clearly, or am I forcing a shape onto a chart that does not really show one?
Step 17: Quick Glossary, Every Pattern in One Place
A fast reference listing every chart pattern from this course in one place. Bookmark this page and jump here any time a pattern name slips your memory.
- Head and Shoulders / Inverse Head and Shoulders: Three peaks (or troughs) with the middle one most extreme, a reversal pattern.
- Double Top / Double Bottom: Two peaks or troughs at a similar level, a reversal pattern.
- Triple Top / Triple Bottom: Three peaks or troughs at a similar level, a reversal pattern.
- Rounding Bottom / Rounding Top: A slow, smooth U shaped curve, a reversal pattern.
- Cup and Handle: A rounded cup shape followed by a small final dip, a bullish continuation pattern.
- Diamond Pattern: Swings that widen and then narrow, tracing a diamond outline, usually a reversal pattern.
- Rectangle Pattern: Price bouncing between a flat support and a flat resistance.
- Symmetrical Triangle: Converging trendlines with no clear directional bias.
- Ascending Triangle: A flat top and a rising bottom, often a bullish bias.
- Descending Triangle: A flat bottom and a falling top, often a bearish bias.
- Broadening Pattern (Megaphone): Swings that get progressively wider over time.
- Flag: A small, parallel channel pause after a sharp move, a continuation pattern.
- Pennant: A small, converging triangle pause after a sharp move, a continuation pattern.
- Measured Move: Projecting the size of a pattern forward from its breakout point, to estimate a price target.
- Neckline: The line connecting the low points (or high points) of a reversal pattern, watched for a confirmed break.
Step 18: What to Do Next
Together with the Candlestick Patterns course, this course completes the full pattern vocabulary used throughout this site. The Price Action Trading course brings candlestick patterns, chart patterns, support, resistance, zones, and trend structure together into one complete trading approach, and is the natural next step from here.
But recognizing a pattern on a chart is only one half of becoming a consistent trader. The other half is the decision-making that happens once real money and real emotion are involved. Samir Dash’s ACE framework (Aware, Control, Execute) at Mindful Trading Hub focuses specifically on that second half, for traders who already know the patterns but still struggle to execute consistently under pressure.
Frequently Asked Questions
What is the difference between a chart pattern and a candlestick pattern?
A candlestick pattern, covered in this site’s dedicated course, is built from one to three candles and plays out quickly. A chart pattern, covered in this course, is built from many candles over a longer stretch of time and shows a broader shape, as explained in Step 1.
Which chart pattern is the most reliable?
No chart pattern is reliable on its own without confirmation. Patterns backed by a clear volume increase on the breakout (Step 13) and aligned with the broader trend context (Step 14) are generally considered more trustworthy than a pattern viewed in isolation.
How is a flag different from a pennant?
They are both short pauses after a sharp move, but a flag’s boundary lines run roughly parallel to each other, while a pennant’s boundary lines converge into a small triangle, as shown in Step 11.
Can a rectangle break out in either direction?
Yes. Unlike most other patterns in this course, a rectangle does not have a fixed expected direction, it can resolve as either a continuation or a reversal, which is exactly why Step 8 emphasizes trading the confirmed breakout direction, not a guess at which way it will go.
Is this investment advice?
No. Samir Dash is not SEBI-registered, and nothing in this course is a stock tip, investment recommendation, or promise of returns. This content is for educational purposes only, explaining how chart patterns work in general. Please read the Disclaimer before acting on anything you read here.
Related Reading on This Site
If you want to go deeper on specific ideas from this course, Samir Dash has written these on blog.samirdash.in:
- Chart Patterns Every Trader Should Know
- Head and Shoulders Pattern: How to Trade It
- Double Top and Double Bottom Patterns Explained
- Triangle Patterns: Ascending, Descending, and Symmetrical
- Cup and Handle Pattern: How to Spot and Trade It
Continue Your Learning Path
You can read both the small signals and the bigger shapes now. Next, put it all together.
- Price Action Trading: the full picture, candles, structure, and patterns combined into one approach.
You can also see every course on this site, in order, and pick your own path.
Want to trade with more clarity and less emotional reactivity? Samir Dash’s ACE framework (Aware, Control, Execute) helps traders build the decision-making discipline that pattern recognition alone can’t teach. Learn more at Mindful Trading Hub.