

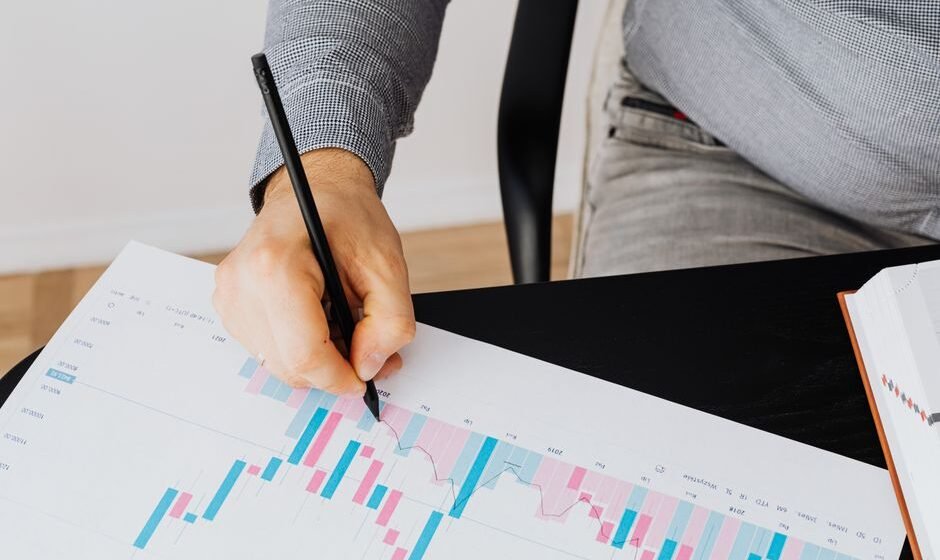

Fibonacci retracement is a tool that takes a recent price swing, from a low to a high or a high to a low, and marks a set of horizontal levels between the two points where price often pauses or reverses during a pullback.
The levels come from a number sequence discovered centuries ago by an Italian mathematician, applied to markets far more recently. This post covers what the tool actually plots, why the levels seem to work as often as they do, an honest look at whether that is a real effect or a self-fulfilling one, and how to use it without over-relying on it.
What is actually being plotted
Pick any clear swing, say Nifty rallying from a low of 23,900 to a high of 24,700. That is an 800-point move. Fibonacci retracement takes that range and marks specific percentage levels back down from the high: 23.6 percent, 38.2 percent, 50 percent, 61.8 percent, and 78.6 percent. The 61.8 percent level, for example, would sit at roughly 24,206, meaning price has retraced 61.8 percent of the 800-point rally.
These percentages come from ratios found in the Fibonacci number sequence, where each number is the sum of the two before it. Dividing numbers in that sequence by the one two places ahead of them consistently produces figures close to 61.8 percent, and similar ratios produce the other levels. The tool simply overlays those percentages onto a real price swing.
Why the levels seem to work
This is the honest, slightly uncomfortable part. There is no proven underlying market mechanism that forces price to respect a 61.8 percent retracement the way there is a clear mechanism explaining why VWAP matters to institutional order flow. The best explanation for why these levels often do coincide with real turning points is that enough traders are watching the same levels and placing orders around them, which makes the levels partly self-fulfilling.
This does not make the tool useless. A level that a large number of market participants are watching and acting on becomes a real level in practice, even if the original mathematical justification is thin. It does mean Fibonacci retracement should be treated as a tool that reflects crowd behaviour around round-feeling numbers, not a tool that reveals some hidden law of price movement.
A worked example on Bank Nifty
Say Bank Nifty rallies from a swing low of 51,200 to a swing high of 52,800, a 1,600-point move. The 50 percent retracement sits at 52,000. The 61.8 percent retracement sits at 51,811. Price pulls back from 52,800 and finds support right around 51,850, close to the 61.8 percent level, then resumes higher toward 53,100.
A trader who had marked this level in advance could have used the reaction near 51,850 as a potential long entry, with a stop below the swing low at 51,200 or below the next Fibonacci level down. What actually made that level meaningful, though, was not some inherent property of the number 61.8. It was that the level sat close to a zone many traders were already watching, and their combined buying activity created the support.
Combining Fibonacci with structure
Fibonacci retracement works best when it lines up with something else already meaningful on the chart, rather than being used in isolation. If the 61.8 percent retracement level happens to sit close to a prior swing low, or close to a round number like 52,000, or close to a rising moving average, that confluence of multiple signals pointing to the same zone is far more useful than the Fibonacci level alone. A level with three independent reasons to matter is more trustworthy than a level with only one.
This is also why Fibonacci retracement is often drawn on top of the swings already identified through plain market structure. Full detail on identifying those swings correctly is in Market Structure: How to Read Higher Highs and Lower Lows. Fibonacci without a correctly identified swing high and low to anchor it produces meaningless levels from the start.
Where it genuinely fails
Fibonacci retracement fails most obviously in a market with no clear swing to measure in the first place. Trying to draw a meaningful retracement inside a choppy, sideways range, where highs and lows are not part of a clean directional move, produces levels that mean very little, because there was no real trending swing for the percentages to describe.
It also fails when traders treat every level as equally significant and enter trades at all five levels on the way down, rather than picking the ones with genuine confluence. A pullback that blows through the 38.2 and 50 percent levels without pausing and only reacts at 78.6 percent should not be treated as five separate trading opportunities. Most of those levels were simply passed through on the way to the one that actually mattered.
The honest answer to “does it work”
Used carelessly, as a standalone magic number applied to any swing without context, Fibonacci retracement performs about as well as any other arbitrary level would, since its power comes mostly from crowd attention rather than an inherent market law. Used carefully, anchored to a genuinely meaningful swing and combined with structure, prior support and resistance, or a round number, it becomes a useful way to define a specific, checkable zone for a pullback entry rather than a vague guess at “somewhere around here.”
The tool does not predict the future. It gives you a precise, testable hypothesis about where a pullback might end, and the market either confirms that hypothesis with a real reaction or it does not.
Fibonacci extensions: the other half of the tool
Retracement levels describe a pullback within an existing swing. A related but separate tool, Fibonacci extension, projects levels beyond the original swing high, used to estimate where a move might extend to once it resumes in the original direction. Using the earlier Bank Nifty example, once price bounced from the 61.8 percent retracement near 51,850 and resumed higher, extension levels projected from the original 51,200 to 52,800 swing might suggest targets around 53,600 or 54,200 for where the next leg could stall.
Extensions carry the same honest caveat as retracements. They are not a guaranteed target, only a level worth watching because enough other traders are likely watching it too. Many traders use extension levels as a place to start scaling out of a winning position rather than as a hard exit rule, treating them as a zone to pay closer attention to rather than an instruction to act on automatically.
Why this tool tests execution discipline specifically
Fibonacci retracement produces a very specific number, like 51,811, which creates a false sense of precision. A trader can watch price approach that exact level and feel like the setup is guaranteed simply because the number looks so precise on the screen. When price actually reaches the level and starts to bounce, the temptation is to size up because the level looks so clean, rather than sticking to the same risk plan used on every other trade. The precision of the number has nothing to do with the reliability of the outcome, and confusing the two is a specific trap this tool sets more than most others.
A note on golden pocket zones
Some traders narrow their focus to the zone between the 61.8 percent and 65 percent retracement levels specifically, sometimes called the golden pocket, treating it as a higher-probability reaction area than the other individual levels. The reasoning is similar to the confluence idea covered earlier: a zone rather than a single exact price gives a little more room for price to react within, without needing to touch one precise number down to the last point.
This is a refinement on the same underlying tool, not a fundamentally different one, and it carries the same honest caveat as the rest of Fibonacci analysis. It works better as a zone to watch closely alongside other confirming signals, such as a bullish candle pattern or a matching structural level, than as a standalone trigger to enter the moment price first touches it.
Frequently asked questions
Is Fibonacci retracement scientifically proven to work?
No. There is no proven mechanism forcing price to respect these exact ratios. The levels appear to work partly because enough traders watch and act on them, which creates a genuine, if self-fulfilling, effect in practice.
Which Fibonacci level is most important?
The 61.8 percent and 50 percent levels are the most commonly watched, but importance depends more on whether the level lines up with other structure, like a prior swing low or a round number, than on the percentage itself.
Should I use Fibonacci retracement alone?
It is generally more reliable when combined with market structure, prior support and resistance, or another indicator, rather than used as a standalone signal on its own.
How do I choose which swing to draw Fibonacci from?
Use a clearly identified swing high and swing low from a genuine directional move, the same kind of swing points covered in market structure reading. Drawing it on a vague or choppy move produces unreliable levels.
Does Fibonacci retracement work better on higher timeframes?
Many traders find it more reliable on higher timeframes like the daily chart, where swings are cleaner and more participants are watching the same levels, compared to noisy lower timeframes with less agreement among traders.
The real point
Fibonacci retracement is neither magic nor useless. It is a way of marking levels that a large number of traders happen to watch, which gives those levels real, if partly self-fulfilling, weight.
The precise-looking number on the screen does not deserve more confidence than your actual risk plan. Treat it as a zone to watch, not a guarantee to bet bigger on.
Number precise lagta hai, market ka wada nahi hota.
Related reading:
- Moving Averages: How Traders Actually Use Them
- Volume Analysis: What High and Low Volume Actually Tell You
- Market Structure: How to Read Higher Highs and Lower Lows
A clean-looking Fibonacci number tempts you to size up beyond your plan. Sticking to the same risk on every setup, precise-looking or not, is the actual discipline. I run a free live session twice a week for traders with two or more years of experience who know the setups but still cannot execute under pressure. Register for the next free session here.
I am Samir Dash, founder of Mindful Trading Hub. I work with experienced traders on live market decision-making. More about my story here.